Baseline TrendBaseline Trend Strategy Overview
Baseline Trend is a crypto-only trading strategy built on straightforward price-based logic: market direction is determined solely by the price’s position relative to a selected baseline open price. No technical indicators like RSI, MACD, or volume are used—this approach is purely focused on price action and position size manipulation.
This strategy is a genuine concept, developed from my own market analysis and logical theory, refined through extensive observation of crypto market behaviour.
While the strategy offers structure and adaptability, it’s important to recognise that no single trading system or indicator fits all market conditions. This tool is meant to support decision-making, not replace it—encouraging traders to stay flexible, informed, and in control of their risk.
Important Usage Note:
This system is intended for crypto markets only.
– When used as an indicator guide, it can be applied to both spot and futures markets.
– However, when used with web-hook automation, it is designed only for futures contracts.
Ensure compatibility with your trading setup before using automation features.
Core Logic: The Baseline
The strategy revolves around the concept of a “Baseline”, with three types available:
Main Baseline: Defines the primary trend direction. If the price is above, go long; if below, go short.
Second Baseline and Third Baseline: Used to measure buying/selling pressure and are key to certain take-profit logic options.
Baselines are customisable to different timeframes—Year, Month, Week, and more—based on available input settings. Structurally, the Main Baseline is the highest-level trend reference, followed by the Second, then Third.
Users can mix and match these baselines across timeframes to backtest crypto symbols and understand behaviour patterns, particularly when used with standard candlestick charts.
Entry & Exit Logic
Entry Signal: Triggered when price crosses over/under a defined distance (percentage) from the Main Baseline. This distance is the Trade Line, calculated based on the close price.
Exit Signal / Stop Loss: If price moves un-favorable and crosses over/under the Stop Loss Line (a defined distance from the Main Baseline), the open position will be force-closed according to user-defined settings.
LiqC (Liquidation Cut)
LiqC is a secondary stop-loss that activates when a leveraged position’s loss equals or exceeds the user-defined liquidation threshold. It forcefully closes the position to help prevent full liquidation before stop-loss, providing an extra layer of protection.
This LiqC is directly tied to the leverage level set by the user. Please ensure you understand how leverage affects liquidation risk, as different broker exchanges may use different liquidation ratio models. Using incorrect assumptions or mismatched leverage values may result in unexpected behaviour.
Position Sizing & Block Units
This strategy features a block-based position sizing system designed for flexibility and precision in trade management:
Block Range: Customisable from 1 to 10 blocks
Risk Allocation: Controlled through a user-defined ROE (Risk of Equity) value
For example, setting an ROE of 0.1% with 10 blocks allocates a total of 1% of account equity to the position. This structure supports both conservative and aggressive risk approaches, depending on user preference.
Block sizes are automatically calculated in alignment with exchange requirements, using Minimum Notional Value (MNV) and Minimum Trade Amount (MTA). These values are dynamically calculated based on the live market price, and scaled relative to the trader’s balance and selected risk percentage. This ensures accurate sizing with built-in adaptability for any account level and current market conditions.
Scalping Meets Trend Holding
This system blends short-term scalping with longer-term trend holding, offering a flexible and adaptive trading style.
Example:
Enter 10 blocks → take quick profits on 5 blocks → let the remaining 5 ride the trend.
This dual-layered approach allows traders to secure early gains while staying positioned for larger market moves. Think of it as:
5 Blocks to Protect: Capture quick wins and manage exposure.
5 Blocks to Pursue: Let profits run by following the broader trend.
By combining both protection and pursuit, the strategy supports risk control without sacrificing the potential for extended returns.
Flexible Take-Profit Logic
The strategy supports multiple, customisable take-profit mechanisms:
TP1–4 (Profit Percentage)
Triggers take profit of 1 block unit when unrealised gains reach defined percentage thresholds (TP1, TP2, TP3, TP4).
Buying/Selling Pressure-Based Take Profit
D1 – Pressure 1
Measures pressure between Second and Third Baselines.
If the distance between them exceeds a user-defined DPT (Decrease Post Threshold) and the price moves far enough from the Third Baseline, D1 activates to take profit or scale out one block.
D2 – Pressure 2
Measures pressure between the Main and Second Baselines.
Works similarly to D1, using a separate distance and pressure trigger.
Note: Both D1 and D2 deactivate in reversal or even trend conditions.
D3–5: High-High / Low-Low Logic
Based on bar index tracking after position entry:
For Long Positions: If after D3 bars the price doesn't exceed the previous bar's high, the system executes a take profit or scale-out.
For Short Positions: If the price doesn't drop below the previous low, the same logic applies.
This approach adds time-based and momentum-aware exit flexibility.
Leverage & Liquidation Risk
When backtesting with leverage enabled, the system checks whether historical candles exceed the liquidation range, calculated based on the average entry price and the leverage input. If the Liquidation Risk Count exceeds 1, profit and loss accuracy may be affected. Traders are encouraged to monitor this count closely to ensure realistic backtesting results.
Since the system cannot directly control or sync with your broker exchange’s actual leverage setting, it’s important to manually match the system’s leverage input with your broker’s configured leverage.
For example: If the system leverage input is set to 10, your exchange leverage setting must also be set to 10. Any mismatch will lead to inaccurate liquidation risk and PnL calculations.
Backtesting and Customisation
All TP1–4 and D1–5 functions are fully optional and customisable. Users are encouraged to backtest different crypto symbols to observe how price behaviour aligns with baseline structures and pressure metrics.
Each of the TP1–4 and D1–5 triggers is designed to execute only once per open position, ensuring controlled and predictable behaviour within each trade cycle.
Since backtesting is based on available historical bar data, please note that data availability varies depending on your TradingView subscription plan. For more reliable insights, it’s recommended to backtest across multiple time ranges, not just the full dataset, to assess the stability and consistency of the strategy’s performance over time.
Additionally, the time frame resolution interval in TradingView is customisable. For best results, use commonly supported time frames such as 30 minutes, 1 hour, 4 hours, 1 day, or 1 week. While the system is designed to support a broad range of intervals, non-standard resolutions may still cause calculation errors.
Currently, the system supports the following resolution ranges:
Intraday: from 1 minute to 720 minutes
(e.g., 60 minutes = 1 hour, 240 minutes = 4 hours, 720 minutes = 12 hours)
Daily: from 1 day to 6 days
Weekly: from 1 week to 3 weeks
Monthly: from 1 month to 4 months
Although the script is built to adapt to various resolutions, users should still monitor output behaviour closely, especially when testing less common or edge-case time frames.
System Usage Notice:
This system can be used as a standalone trading indicator or integrated with an exchange that supports web-hook signal execution. If you choose to automate trades via web-hook, please ensure you fully understand how to configure the setup properly. Web-hook integration methods vary between exchanges, and incorrect setup may lead to unintended trades. Users are responsible for ensuring proper configuration and monitoring of their automation.
Note on Lower Time Frame Usage
When using lower time frames (e.g., 1-minute charts) as the trading time frame, please be aware that available historical data may be limited depending on your subscription plan. This can affect the depth and reliability of backtesting, making it harder to establish a trustworthy probability model for a symbol’s behaviour over time.
Additionally, when pairing a high-level Main Baseline (MBL) time line (such as "1 Month") with low time frame resolutions (like 1-minute), you may encounter order execution limits or calculation overloads during backtesting. This is due to the large number of historical bars required, which can strain the system's capacity.
That said, if a user intentionally chooses to work with lower time frames, that decision is fully respected—but it should be done with awareness and at the user’s own risk.
Things to Be Aware Of (Web-hook Usage Only)
The following points apply if you're using web-hook automation to send signals from the system to an exchange:
Alert Signal Reliability
During extreme market volatility, some broker exchanges may fail to respond to web-hook signals due to traffic overload. While rare, this has occurred in the past and should be considered when relying on automation.
Alert Expiration (TradingView)
If you're on a Basic plan, TradingView alerts are only active for a limited time—typically around 1.5 months. Once expired, signals will no longer be sent out.
To keep your system active, reset the alert before expiration. For uninterrupted alerts, consider upgrading to a Premium plan, which supports permanent alert activation.
TradingView Alert Maintenance
TradingView may occasionally perform system maintenance, during which alerts may temporarily stop functioning. It’s recommended to monitor TradingView’s status if you’re relying on real-time automation.
Repainting
As of the current version, no repainting behaviour has been observed. Signal stability and consistency have been maintained across real-time and historical bars.
Order Execution Type and Fill Logic
All signals use Limit orders by default, except for MBL Exit and Fallback execution, which use Market orders.
Since Limit orders are not guaranteed to fill, the system includes logic to cancel unfilled orders and resend them. If necessary, a Fallback Market order is used to avoid conflict with new incoming trades.
This has only happened once, and is considered rare, but users should always monitor execution status to ensure accuracy and alignment with system behaviour.
Feedback
If you encounter any errors, bugs, or unexpected behaviour while using the system, please don’t hesitate to let me know. Your input is invaluable for helping improve the strategy in future updates.
Likewise, if you have any suggestions or ideas for enhancing the system—whether it’s a new feature, adjustment, or usability improvement—please feel free to share. Together, we can continue refining the tool to make it more robust and beneficial for everyone.
Disclaimer
All trading involves risk, particularly in the crypto market where conditions can be highly volatile. Past performance does not guarantee future outcomes, and market behaviour may evolve over time. This strategy is offered as a tool to support trading decisions and should not be considered financial or investment advice. Each user is responsible for their own actions and accepts full responsibility for any results that may arise from using this system.
"high low" için komut dosyalarını ara

RSI Divergence Strategy - AliferCryptoStrategy Overview
The RSI Divergence Strategy is designed to identify potential reversals by detecting regular bullish and bearish divergences between price action and the Relative Strength Index (RSI). It automatically enters positions when a divergence is confirmed and manages risk with configurable stop-loss and take-profit levels.
Key Features
Automatic Divergence Detection: Scans for RSI pivot lows/highs vs. price pivots using user-defined lookback windows and bar ranges.
Dual SL/TP Methods:
- Swing-based: Stops placed a configurable percentage beyond the most recent swing high/low.
- ATR-based: Stops placed at a multiple of Average True Range, with a separate risk/reward multiplier.
Long and Short Entries: Buys on bullish divergences; sells short on bearish divergences.
Fully Customizable: Input groups for RSI, divergence, swing, ATR, and general SL/TP settings.
Visual Plotting: Marks divergences on chart and plots stop-loss (red) and take-profit (green) lines for active trades.
Alerts: Built-in alert conditions for both bullish and bearish RSI divergences.
Detailed Logic
RSI Calculation: Computes RSI of chosen source over a specified period.
Pivot Detection:
- Identifies RSI pivot lows/highs by scanning a lookback window to the left and right.
- Uses ta.barssince to ensure pivots are separated by a minimum/maximum number of bars.
Divergence Confirmation:
- Bullish: Price makes a lower low while RSI makes a higher low.
- Bearish: Price makes a higher high while RSI makes a lower high.
Entry:
- Opens a Long position when bullish divergence is true.
- Opens a Short position when bearish divergence is true.
Stop-Loss & Take-Profit:
- Swing Method: Computes the recent swing high/low then adjusts by a percentage margin.
- ATR Method: Uses the current ATR × multiplier applied to the entry price.
- Take-Profit: Calculated as entry price ± (risk × R/R ratio).
Exit Orders: Uses strategy.exit to place bracket orders (stop + limit) for both long and short positions.
Inputs and Configuration
RSI Settings: Length & price source for the RSI.
Divergence Settings: Pivot lookback parameters and valid bar ranges.
SL/TP Settings: Choice between Swing or ATR method.
Swing Settings: Swing lookback length, margin (%), and risk/reward ratio.
ATR Settings: ATR length, stop multiplier, and risk/reward ratio.
Usage Notes
Adjust the Pivot Lookback and Range values to suit the volatility and timeframe of your market.
Use higher ATR multipliers for wider stops in choppy conditions, or tighten swing margins in trending markets.
Backtest different R/R ratios to find the balance between win rate and reward.
Disclaimer
This script is for educational purposes only and does not constitute financial advice. Trading carries significant risk and you may lose more than your initial investment. Always conduct your own research and consider consulting a professional before making any trading decisions.

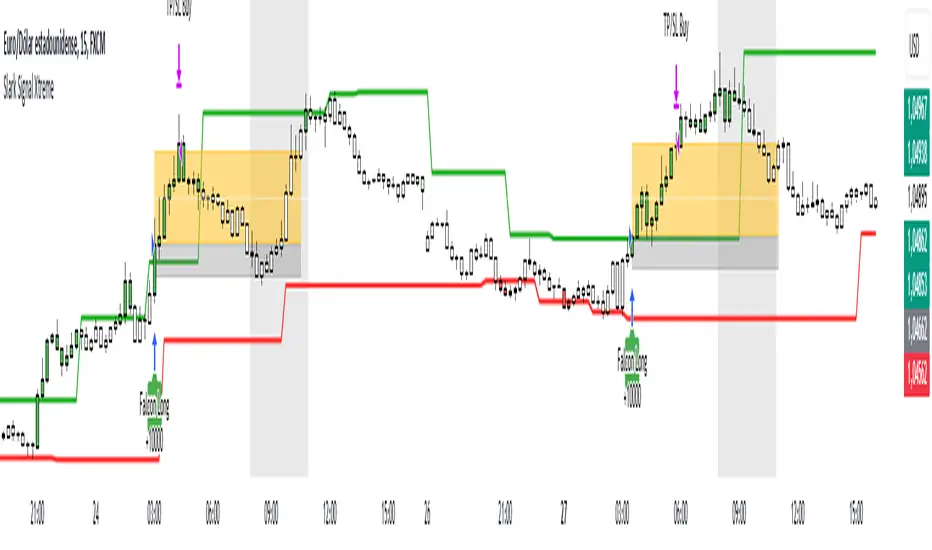
Slark Signal XtremeStrategy Description: Slark Signal Xtreme
The Slark Signal Xtreme is an innovative trading strategy designed to identify and capitalize on market opportunities by leveraging pivots, trend breakouts, and dynamic risk management. This strategy combines day-of-week and time filters with a ticks-based Stop Loss (SL) and Take Profit (TP) system, delivering customized signals and real-time alerts. Ideal for traders seeking a structured and highly customizable approach, Slark Signal Xtreme also incorporates advanced visual tools for efficient trade management.
Key Features:
Pivot- and Breakout-Based Signals: Utilizes pivot detection (highs/lows) combined with an ATR-based slope calculation to pinpoint trend changes and potential entry or exit points.
Dynamic Stop-Loss (SL) and Take-Profit (TP) Levels: Automatically calculates SL and TP based on the entry price and user-defined tick settings, adapting to volatility and optimizing risk management.
Time and Day Filters: Allows you to select specific days of the week and trading sessions during which signals are generated, avoiding low-liquidity periods or unwanted high volatility.
Customizable Risk Management: Lets you define the number of ticks for SL and TP, trading hours, initial capital, pyramiding, and commissions, tailoring the strategy to various risk profiles and assets.
Enhanced Visualization:
- SL and TP Boxes: Displays rectangular boxes on the chart indicating SL and TP levels, streamlining trade management.
- Candle Color Changes: Candles can be colored according to price position relative to pivot lines (bullish, bearish, or neutral).
- Session Highlight: Shades the chart background during the selected trading hours, providing immediate context on when the strategy is active.
Automated Alerts: Generates customizable alerts in TradingView whenever a buy or sell signal is triggered, detailing the timing, instrument, and SL/TP levels.
How the Strategy Works:
Technical Indicator Calculations:
- Pivot High/Low and Slope: Identifies price pivot points and calculates slope (based on ATR) to measure trend strength.
- Time and Day Filters: Signals only trigger within the specified days and hours, helping avoid undesirable market conditions.
Generating Buy and Sell Signals:
- Buy Signal (Long): Activated when price breaks above a downward pivot-based trendline or meets the condition for higher pivots.
- Sell Signal (Short): Activated when price breaks below an upward pivot-based trendline or meets the condition for lower pivots.
- Operation Conditions: Signals are only generated on selected days and during chosen trading hours, avoiding periods of low liquidity or excessive volatility.
Dynamic SL and TP Calculation:
- Stop-Loss (SL) and Take-Profit (TP): Determined by the entry price ± a user-defined number of ticks.
- SL and TP Visualization: Boxes are drawn on the chart from the entry price to SL/TP levels, enabling clear visual reference for trade management.
Order Execution and Alerts:
- Order Execution: When a signal is generated, Slark Signal Xtreme automatically opens a long or short position in TradingView’s backtesting environment.
- Alerts: Customizable alerts can be set up to provide real-time notifications (via TradingView or third-party integrations), offering essential details like instrument, time, SL/TP, etc.
Trade Management and Monitoring:
- Automatic Closure: Each trade is automatically closed upon reaching its SL or TP, ensuring disciplined risk control.
- Trade Summary: TradingView’s built-in reporting tools list all trades with cumulative results, simplifying performance evaluation.
Additional Visualization:
- Candle Coloring by Trend: Candles can be colored bullish, bearish, or neutral based on the pivot-driven trend detection.
- Operational Range Highlighting: The chart background is shaded during the permitted trading hours, clarifying when the strategy is active and enhancing visibility.
---
Strategy Properties (Important)
This backtest was conducted in TradingView under the following configuration:
Initial Capital: 1000 USD
Order Size: 10,000 contracts (adjust according to the traded asset)
Commission: 0.05 USD per order
Slippage: 1 tick
Pyramiding: 1 order
Price Verification for Limit Orders: 0 ticks
Recalculate on Every Tick & On Bar Close: Enabled
Bar Magnifier for Backtesting Precision: Enabled
These properties provide a realistic view of the strategy’s performance. However, default parameters may vary depending on each user or market:
Order Size: Should be calculated according to the asset traded and your desired risk level.
Commission and Slippage: Costs can vary by market and instrument; there is no universal default that guarantees realistic results.
All users are strongly recommended to adjust these properties within the script settings to match their own trading accounts and platforms, ensuring the most accurate backtest results.
---
Backtesting Results:
- Net Profit: +28.70
- Total Trades: 397
- Winning Trades: 138
- Win Rate: 34.76%
- Profit Factor: 1.07
- Sharpe Ratio: 1.25
- Sortino Ratio: 1.45
- Average Bars per Trade: 24
- Average Profit per Trade: 1.45
These numbers provide an overview of the strategy’s historical performance, demonstrating its potential for profitability given appropriate risk management.
---
Interpretation of Results:
- The strategy can be profitable despite a relatively modest win rate, thanks to a suitable risk-reward ratio.
- A profit factor of 1.07 indicates that total profits slightly exceed total losses.
- It is essential to monitor drawdown and ensure it aligns with your personal risk tolerance.
---
Risk Warning:
Trading leveraged financial instruments carries a high level of risk and may not be suitable for all investors. Before trading, carefully consider your investment objectives, experience level, and risk tolerance. Past performance does not guarantee future results. Always perform additional testing and adjust the strategy to your specific needs.
---
What Makes This Strategy Original?
Focus on Pivots and Time/Day Filters: Rather than purely relying on momentum indicators, Slark Signal Xtreme uses pivot-based signals and scheduling filters to capture higher-liquidity, directional market moves.
Dynamic Risk Management: Ticks-based SL/TP and customizable trading sessions enable precise adaptation to various markets and trading styles.
Advanced Visualization Tools: SL/TP boxes, candle coloring, and session highlights streamline market interpretation and facilitate real-time decision-making.
Seamless Alert Integration: Although native TradingView alerts are provided, it can be integrated with third-party messaging services (Telegram, Discord, etc.) for enhanced automation.
---
Additional Considerations
Continuous Testing and Optimization: Regularly backtest and fine-tune parameters (SL, TP, time filters, etc.) to accommodate changing market conditions.
Complementary Analysis: Combine this strategy with other technical or fundamental tools to confirm signals.
Rigorous Risk Management: Ensure SL/TP levels and position sizes conform to your overall risk management plan.
Updates and Support: Future updates and improvements may be released based on community feedback. For questions or suggestions, feel free to reach out.
---
Example Configuration
Assume you want to run Slark Signal Xtreme with these settings:
Trading Days: Monday to Friday
Trading Hours: 8:00 to 11:00 (exchange or broker time)
Stop Loss (SL) in Ticks: 100
Take Profit (TP) in Ticks: 300
SL/TP Box Extension: 20 bars
Initial Capital: 1000 USD
Risk per Trade: 1% of capital
Commissions & Slippage: 0.05 USD commission, 1 tick slippage
---
Conclusion
The Slark Signal Xtreme strategy delivers a robust and adaptable solution by merging pivots, time/day filters, flexible risk parameters, and advanced visualization. Its distinctive and customizable design makes it a powerful resource for traders aiming to diversify their methods and exploit trend breakouts under specific conditions. Fully compatible with TradingView, Slark Signal Xtreme can enhance your trading toolkit and foster a more systematic approach to your operations.
---
Final Disclaimer:
Financial markets are inherently volatile and pose significant risks. This strategy should be employed as part of a comprehensive trading plan and does not guarantee positive outcomes. Always consult a qualified financial advisor before making investment decisions. The use of Slark Signal Xtreme is solely at the user’s discretion, who must evaluate personal risk tolerance and financial objectives.
Internal Bar Strength (IBS) Strategy█ STRATEGY DESCRIPTION
The "Internal Bar Strength (IBS) Strategy" is a mean-reversion strategy designed to identify trading opportunities based on the closing price's position within the daily price range. It enters a long position when the IBS indicates oversold conditions and exits when the IBS reaches overbought levels. This strategy was designed to be used on the daily timeframe.
█ WHAT IS INTERNAL BAR STRENGTH (IBS)?
Internal Bar Strength (IBS) measures where the closing price falls within the high-low range of a bar. It is calculated as:
IBS = (Close - Low) / (High - Low)
- **Low IBS (≤ 0.2)**: Indicates the close is near the bar's low, suggesting oversold conditions.
- **High IBS (≥ 0.8)**: Indicates the close is near the bar's high, suggesting overbought conditions.
█ SIGNAL GENERATION
1. LONG ENTRY
A Buy Signal is triggered when:
The IBS value drops below the Lower Threshold (default: 0.2).
The signal occurs within the specified time window (between `Start Time` and `End Time`).
2. EXIT CONDITION
A Sell Signal is generated when the IBS value rises to or above the Upper Threshold (default: 0.8). This prompts the strategy to exit the position.
█ ADDITIONAL SETTINGS
Upper Threshold: The IBS level at which the strategy exits trades. Default is 0.8.
Lower Threshold: The IBS level at which the strategy enters long positions. Default is 0.2.
Start Time and End Time: The time window during which the strategy is allowed to execute trades.
█ PERFORMANCE OVERVIEW
This strategy is designed for ranging markets and performs best when prices frequently revert to the mean.
It is sensitive to extreme IBS values, which help identify potential reversals.
Backtesting results should be analyzed to optimize the Upper/Lower Thresholds for specific instruments and market conditions.

BTC 5 min SHBHilalimSB A Wedding Gift 🌙
What is HilalimSB🌙?
First of all, as mentioned in the title, HilalimSB is a wedding gift.
HilalimSB - Revealing the Secrets of the Trend
HilalimSB is a powerful indicator designed to help investors analyze market trends and optimize trading strategies. Designed to uncover the secrets at the heart of the trend, HilalimSB stands out with its unique features and impressive algorithm.
Hilalim Algorithm and Fixed ATR Value:
HilalimSB is equipped with a special algorithm called "Hilalim" to detect market trends. This algorithm can delve into the depths of price movements to determine the direction of the trend and provide users with the ability to predict future price movements. Additionally, HilalimSB uses its own fixed Average True Range (ATR) value. ATR is an indicator that measures price movement volatility and is often used to determine the strength of a trend. The fixed ATR value of HilalimSB has been tested over long periods and its reliability has been proven. This allows users to interpret the signals provided by the indicator more reliably.
ATR Calculation Steps
1.True Range Calculation:
+ The True Range (TR) is the greatest of the following three values:
1. Current high minus current low
2. Current high minus previous close (absolute value)
3. Current low minus previous close (absolute value)
2.Average True Range (ATR) Calculation:
-The initial ATR value is calculated as the average of the TR values over a specified period
(typically 14 periods).
-For subsequent periods, the ATR is calculated using the following formula:
ATRt=(ATRt−1×(n−1)+TRt)/n
Where:
+ ATRt is the ATR for the current period,
+ ATRt−1 is the ATR for the previous period,
+ TRt is the True Range for the current period,
+ n is the number of periods.
Pine Script to Calculate ATR with User-Defined Length and Multiplier
Here is the Pine Script code for calculating the ATR with user-defined X length and Y multiplier:
//@version=5
indicator("Custom ATR", overlay=false)
// User-defined inputs
X = input.int(14, minval=1, title="ATR Period (X)")
Y = input.float(1.0, title="ATR Multiplier (Y)")
// True Range calculation
TR1 = high - low
TR2 = math.abs(high - close )
TR3 = math.abs(low - close )
TR = math.max(TR1, math.max(TR2, TR3))
// ATR calculation
ATR = ta.rma(TR, X)
// Apply multiplier
customATR = ATR * Y
// Plot the ATR value
plot(customATR, title="Custom ATR", color=color.blue, linewidth=2)
This code can be added as a new Pine Script indicator in TradingView, allowing users to calculate and display the ATR on the chart according to their specified parameters.
HilalimSB's Distinction from Other ATR Indicators
HilalimSB emerges with its unique Average True Range (ATR) value, presenting itself to users. Equipped with a proprietary ATR algorithm, this indicator is released in a non-editable form for users. After meticulous testing across various instruments with predetermined period and multiplier values, it is made available for use.
ATR is acknowledged as a critical calculation tool in the financial sector. The ATR calculation process of HilalimSB is conducted as a result of various research efforts and concrete data-based computations. Therefore, the HilalimSB indicator is published with its proprietary ATR values, unavailable for modification.
The ATR period and multiplier values provided by HilalimSB constitute the fundamental logic of a trading strategy. This unique feature aids investors in making informed decisions.
Visual Aesthetics and Clear Charts:
HilalimSB provides a user-friendly interface with clear and impressive graphics. Trend changes are highlighted with vibrant colors and are visually easy to understand. You can choose colors based on eye comfort, allowing you to personalize your trading screen for a more enjoyable experience. While offering a flexible approach tailored to users' needs, HilalimSB also promises an aesthetic and professional experience.
Strong Signals and Buy/Sell Indicators:
After completing test operations, HilalimSB produces data at various time intervals. However, we would like to emphasize to users that based on our studies, it provides the best signals in 1-hour chart data. HilalimSB produces strong signals to identify trend reversals. Buy or sell points are clearly indicated, allowing users to develop and implement trading strategies based on these signals.
For example, let's imagine you wanted to open a position on BTC on 2023.11.02. You are aware that you need to calculate which of the buying or selling transactions would be more profitable. You need support from various indicators to open a position. Based on the analysis and calculations it has made from the data it contains, HilalimSB would have detected that the graph is more suitable for a selling position, and by producing a sell signal at the most ideal selling point at 08:00 on 2023.11.02 (UTC+3 Istanbul), it would have informed you of the direction the graph would follow, allowing you to benefit positively from a 2.56% decline.
Technology and Innovation:
HilalimSB aims to enhance the trading experience using the latest technology. With its innovative approach, it enables users to discover market opportunities and support their decisions. Thus, investors can make more informed and successful trades. Real-Time Data Analysis: HilalimSB analyzes market data in real-time and identifies updated trends instantly. This allows users to make more informed trading decisions by staying informed of the latest market developments. Continuous Update and Improvement: HilalimSB is constantly updated and improved. New features are added and existing ones are enhanced based on user feedback and market changes. Thus, HilalimSB always aims to provide the latest technology and the best user experience.
Social Order and Intrinsic Motivation:
Negative trends such as widespread illegal gambling and uncontrolled risk-taking can have adverse financial effects on society. The primary goal of HilalimSB is to counteract these negative trends by guiding and encouraging users with data-driven analysis and calculable investment systems. This allows investors to trade more consciously and safely.
What is BTC 5 min ☆SHB Strategy🌙?
BTC 5 min ☆SHB Strategy is a strategy supported by the HilalimSB algorithm created by the creator of HilalimSB. It automatically opens trades based on the data it receives, maintaining trades with its uniquely defined take profit and stop loss levels, and automatically closes trades when necessary. It stands out in the TradingView world with its unique take profit and stop loss markings. BTC 5 min ☆SHB Strategy is close to users' initiatives and is a strategy suitable for 5-minute trades and scalp operations developed on BTC.
What does the BTC 5 min ☆SHB Strategy target?
The primary goal of BTC 5 min ☆SHB Strategy is to close trades made by traders in short timeframes as profitably as possible and to determine the most effective trading points in low time periods, considering the commission rates of various brokerage firms. BTC 5 min ☆SHB Strategy is one of the rare profitable strategies released in short timeframes, with its useful interface, in addition to existing strategies in the markets. After extensive backtesting over a long period and achieving above-average success, BTC 5 min ☆SHB Strategy was decided to be released. Following the completion of test procedures under market conditions, it was presented to users with the unique visual effects of ☆SB.
BTC 5 min ☆SHB Strategy and Heikin Ashi
BTC 5 min ☆SHB Strategy produces data in Heikin-Ashi chart types, but since Heikin-Ashi chart types have their own calculation method, BTC 5 min ☆SHB Strategy has been published in a way that cannot produce data in this chart type due to BTC 5 min ☆SHB Strategy's ideology of appealing to all types of users, and any confusion that may arise is prevented in this way. Heikin-Ashi chart types, especially in short time intervals, carry significant risks considering the unique calculation methods involved. Thus, the possibility of being misled by the coder and causing financial losses has been completely eliminated. After the necessary conditions determined by the creator of BTC 5 min ☆SHB are met, BTC 5 min ☆SHB Heikin-Ashi will be shared exclusively with invited users only, upon request, to users who request an invitation.
Key Features:
+HilalimSHB Algorithm: This algorithm uses a dynamic ATR-based trend-following mechanism to identify the current market trend. The strategy detects trend reversals and takes positions accordingly.
+Heikin Ashi Compatibility: The strategy is optimized to work only with standard candlestick charts and automatically deactivates when Heikin Ashi charts are in use, preventing false signals.
+Advanced Chart Enhancements: The strategy offers clear graphical markers for buy/sell signals. Candlesticks are automatically colored based on trend direction, making market trends easier to follow.
Strategy Parameters:
+Take Profit (%): Defines the target price level for closing a position and automates profit-taking. The fixed value is set at 2%.
+Stop Loss (%): Specifies the stop-loss level to limit losses. The fixed value is set at 3%.
The shared image is a 5-minute chart of BTCUSDC.P with a fixed take profit value of 2% and a fixed stop loss value of 3%. The trades are opened with a commission rate of 0.063% set for the USDT trading pair on Binance.🌙

Long-Only Opening Range Breakout (ORB) with Pivot PointsIntraday Trading Strategy: Long-Only Opening Range Breakout (ORB) with Pivot Points
Background:
Opening Range Breakout (ORB) is a popular long-only trading strategy that capitalizes on the early morning volatility in financial markets. It's based on the idea that the initial price movements during the first few minutes or hours of the trading day can set the tone for the rest of the session. The strategy involves identifying a price range within which the asset trades during the opening period and then taking long positions when the price breaks out to the upside of this range.
Pivot Points are a widely used technical indicator in trading. They represent potential support and resistance levels based on the previous day's price action. Pivot points are calculated using the previous day's high, low, and close prices and can help traders identify key price levels for making trading decisions.
How to Use the Script:
Initialization: This script is written in Pine Script, a domain-specific language for trading strategies on the TradingView platform. To use this script, you need to have access to TradingView.
Apply the Script: You can do this by adding it to your favorites, then selecting the script in the indicators list under favorites or by searching for it by name under community scripts.
Customize Settings: The script allows you to customize various settings through the TradingView interface. These settings include:
Opening Session: You can set the time frame for the opening session.
Max Trades per Day: Specify the maximum number of long trades allowed per trading day.
Initial Stop Loss Type: Choose between using a percentage-based stop loss or the previous candles low for stop loss calculations.
Stop Loss Percentage: If you select the percentage-based stop loss, specify the percentage of the entry price for the stop loss.
Backtesting Start and End Time: Set the time frame for backtesting the strategy.
Strategy Signals:
The script will display pivot points in blue (R1, R2, R3, R4, R5) and half-pivot points in gray (R0.5, R1.5, R2.5, R3.5, R4.5) on your chart.
The green line represents the opening range.
The script generates long (buy) signals based on specific conditions:
---The open price is below the opening range high (h).
---The current high price is above the opening range high.
---Pivot point R1 is above the opening range high.
---It's a long-only strategy designed to capture upside breakouts.
---It also respects the maximum number of long trades per day.
The script manages long positions, calculates stop losses, and adjusts long positions according to the defined rules.
Trailing Stop Mechanism
The script incorporates a dynamic trailing stop mechanism designed to protect and maximize profits for long positions. Here's how it works:
1. Initialization:
The script allows you to choose between two types of initial stop loss:
---Percentage-based: This option sets the initial stop loss as a percentage of the entry price.
---Previous day's low: This option sets the initial stop loss at the previous day's low.
2. Setting the Initial Stop Loss (`sl_long0`):
The initial stop loss (`sl_long0`) is calculated based on the chosen method:
---If "Percentage" is selected, it calculates the stop loss as a percentage of the entry price.
---If "Previous Low" is selected, it sets the stop loss at the previous day's low.
3. Dynamic Trailing Stop (`trail_long`):
The script then monitors price movements and uses a dynamic trailing stop mechanism (`trail_long`) to adjust the stop loss level for long positions.
If the current high price rises above certain pivot point levels, the trailing stop is adjusted upwards to lock in profits.
The trailing stop levels are calculated based on pivot points (`r1`, `r2`, `r3`, etc.) and half-pivot points (`r0.5`, `r1.5`, `r2.5`, etc.).
The script checks if the high price surpasses these levels and, if so, updates the trailing stop accordingly.
This dynamic trailing stop allows traders to secure profits while giving the position room to potentially capture additional gains.
4. Final Stop Loss (`sl_long`):
The script calculates the final stop loss level (`sl_long`) based on the following logic:
---If no position is open (`pos == 0`), the stop loss is set to zero, indicating there is no active stop loss.
---If a position is open (`pos == 1`), the script calculates the maximum of the initial stop loss (`sl_long0`) and the dynamic trailing stop (`trail_long`).
---This ensures that the stop loss is always set to the more conservative of the two values to protect profits.
5. Plotting the Stop Loss:
The script plots the stop loss level on the chart using the `plot` function.
It will only display the stop loss level if there is an open position (`pos == 1`) and it's not a new trading day (`not newday`).
The stop loss level is shown in red on the chart.
By combining an initial stop loss with a dynamic trailing stop based on pivot points and half-pivot points, the script aims to provide a comprehensive risk management mechanism for long positions. This allows traders to lock in profits as the price moves in their favor while maintaining a safeguard against adverse price movements.
End of Day (EOD) Exit:
The script includes an "End of Day" (EOD) exit mechanism to automatically close any open positions at the end of the trading day. This feature is designed to manage and control positions when the trading day comes to a close. Here's how it works:
1. Initialization:
At the beginning of each trading day, the script identifies a new trading day using the `is_newbar('D')` condition.
When a new trading day begins, the `newday` variable becomes `true`, indicating the start of a new trading session.
2. Plotting the "End of Day" Signal:
The script includes a plot on the chart to visually represent the "End of Day" signal. This is done using the `plot` function.
The plot is labeled "DayEnd" and is displayed as a comment on the chart. It signifies the EOD point.
3. EOD Exit Condition:
When the script detects that a new trading day has started (`newday == true`), it triggers the EOD exit condition.
At this point, the script proceeds to close all open positions that may have been active during the trading day.
4. Closing Open Positions:
The `strategy.close_all` function is used to close all open positions when the EOD exit condition is met.
This function ensures that any remaining long positions are exited, regardless of their current profit or loss.
The function also includes an `alert_message`, which can be customized to send an alert or notification when positions are closed at EOD.
Purpose of EOD Exit
The "End of Day" exit mechanism serves several essential purposes in the trading strategy:
Risk Management: It helps manage risk by ensuring that positions are not left open overnight when markets can experience increased volatility.
Capital Preservation: Closing positions at EOD can help preserve trading capital by avoiding potential adverse overnight price movements.
Rule-Based Exit: The EOD exit is rule-based and automatic, ensuring that it is consistently applied without emotions or manual intervention.
Scalability: It allows the strategy to be applied to various markets and timeframes where EOD exits may be appropriate.
By incorporating an EOD exit mechanism, the script provides a comprehensive approach to managing positions, taking profits, and minimizing risk as each trading day concludes. This can be especially important in volatile markets like cryptocurrencies, where overnight price swings can be significant.
Backtesting: The script includes a backtesting feature that allows you to test the strategy's performance over historical data. Set the start and end times for backtesting to see how the long-only strategy would have performed in the past.
Trade Execution: If you choose to use this script for live trading, make sure you understand the risks involved. It's essential to set up proper risk management, including position sizing and stop loss orders.
Monitoring: Monitor the long-only strategy's performance over time and be prepared to make adjustments as market conditions change.
Disclaimer: Trading carries a risk of capital loss. This script is provided for educational purposes and as a starting point for your own long-only strategy development. Always do your own research and consider seeking advice from a qualified financial professional before making trading decisions.

Strategy: Range BreakoutWhat?
In the price action, levels have a significant role to play. Based on the price moving above/below the levels - the underlying instrument shows some price-action in the direction of breakout/breakdown.
There are plenty of ways level can be determined. Levels are the decision point to take a trade or not. But if we make the level derivation complex, then the execution may get hamper.
This strategy script, developed in PineScript v5, is our attempt at solving this problem at the core by providing this simple, yet elegant solution to this problem.
It's essentially an attempt to Trade Simple by drawing logical (horizontal) lines in the chart and take actions, after multiple associated parameters confirmation, on the breakout / breakdown of the levels.
How?
Let us explain how we are drawing the levels.
We are depending on some of the parameters as described below:
Open Range : During intraday movement, often if prices move beyond a particular level, it exibits more movement in the same swing in same direction. We found out, through our back testing for Indian Indices like NSE:NIFTY , NSE:BANKNIFTY or NSE:CNXFINANCE the first 15m (i.e 09:15 AM to 09:30 AM, IST) is one of such range. For Indian stocks, it is 9:15 to 9:45. And for MCX MCX:CRUDEOIL1! it's 5:00 pm to 6:00 pm. There are our first levels.
PDHCL : Previous Day High, Close, Low. This is our next level
VWAP : The rolling VWAP (volume weighted average price)
In the breakout/breakdown of the Open Range and Previous Day High/Low, we are taking the trade decisions as follows using CEST principle:
C onditions :
If current bar's (say you are in 5m timeframe) closing is broken out the Open Range High or Previous Day High, taken a Buy/Long decision (let's say buying a Call Option CE or selling a Put Option PE or buying the future or cash).
If current bar's (say you are in 5m timeframe) closing is broken down the Open Range Low or Previous Day Low, taken a Sell/Short decision (let's say buying a Put Option CE or selling a Call Option PE or selling the future or cash).
Additionally, and optionally (default ON, one can turn off): we are checking various other associated multiple confirmations as follows:
1. Momentum : Checking 14-period RSI value is more than 50 or less than 50 (all parameters like period, OB, OS ranges are configurable through settings)
2. Current bar's volume is more than the last 20 bars volume average. How much more - that multiplier is also configurable. (default is 1)
3. The breakout candle is bullish (green) or bearish (red).
E ntry :
All of these happens only on the closing of the candle . Means: Non Repainting! .
Clearly in the chart we are showing as green up arrow BO (breakout for buy) and red down arrow BD (breakdown for sell) to take your decision process smooth.
So, on the closing of the decision BO/BD candle we are entering the trade (with a thumping heart and nail biting ...)
S top Loss :
We are relying on the time tasted (last 40 years) mechanism of Average True Range (ATR) of default 14 period. This default period is also configurable.
So for Long trades: the 14 period ATR low band is the SL.
For Short trades: the 14 period ATR high band is the SL.
T arget :
We are depending on the thump rule of 1:2 Risk Reward. It's simple and effective. No fancy thing. We are closing the trade on double the favorable price movement compared to the SL placed. Of course, this RR ratio is confiurable from the settings, as usual.
What's Unqiue in it?
The utter simplicity of this trading mechanism. No fancy things like complex chart pattern, OI data, multiple candlestick patterns, Order flow analysis etc.
Simple level determination,
Marking clearly in the chart.
Making each parameter configurable in Settings and showing tooltip adjacent to the parameter to make you understand it better for your customization,
Wait for the candle close, thus eliminating the chances of repainting menace (as much as possible)
Additional momentum and volume check to trade entry confirmation.
Works with normal candlestick (nothing special ones like HA ...)
Showing everything as a Summary Table (which, again can be turned off optionally) overlaying at the bottom-right corner of the chart,
Optionally the Summary Table can be configured to alert you back (say you get it notified in your email or SMS).
That way, a single, simple, effective trade setup will ease your journey as smooth sail as possible.
Mentions
There are plenty of friends from whom time to time we borrowed some of the ideas while working closely together over last one year.
From tradingview community, we took the spirit of @zzzcrypto123 awesome work done long back (in 2020) as the indicator "ORB - Opening Range Breakout". (We tried to reach him for his explicit consent, unable to catch hold of him).
Some other publicly available materials we have consulted to get the additional checks (like RSI, volume).
Lat word
Use it please and thank you for your constant patronage in following us in this awesome platform. Let's keep growing together.
Disclaimer :
This piece of software does not come up with any warrantee or any rights of not changing it over the future course of time.
We are not responsible for any trading/investment decision you are taking out of the outcome of this indicator.

TitanEdge Algo Suite — 4H BTC & ETH (Delta Exchange Ready)TitanEdge Algo Suite — 4H BTC & ETH (Delta Exchange Ready)
TitanEdge Algo Suite is a next-generation trading system that fuses volatility-adaptive logic, order-block structure, SuperTrend direction filtering, and ATR-based exits into a single modular framework.
It’s engineered for 4-hour BTC and ETH swing trading, delivering institutional-grade entries, dynamic risk control, and precise exits.
⚙️ Core Features
1. Volatility Oscillator (0–100)
• Filters trades by volatility intensity.
• Uses ATR, Range, or Bollinger Band Width normalization.
• Trades trigger only when market volatility is high — filtering out sideways or weak trends.
• Ensures trades occur during real momentum expansions.
2. Breakout + Order Block Engine
• Detects pivot highs/lows to confirm authentic breakout levels.
• Identifies “smart money” gaps — institutional imbalance zones often leading to strong reversals or continuations.
• Captures both breakout continuations and order-block reversals.
• Works as a hybrid structure detector combining price action and volatility alignment.
3. SuperTrend Directional Filter
• Optional filter that only allows trades in the direction of the SuperTrend.
• Can automatically close trades when a SuperTrend flip occurs.
• Provides strong trend-following bias and helps avoid countertrend traps.
4. ATR-Based Stop & Trailing System
• Adaptive stop-loss and trailing logic that expands or tightens based on volatility.
• Supports three modes: StopOnly, TrailOnly, and StopAndTrail.
• Works in both ATR-based distance or percentage-based configuration.
• Keeps losing trades small and lets winning trades extend dynamically.
5. Volume-Based Exit Logic
• Detects low-volume exhaustion to identify momentum loss.
• Detects opposite-volume spikes as early reversal signals.
• Optional hybrid “Both” mode combines both detection methods for stronger reliability.
• Ideal for markets where volume surges indicate smart money exits or trap formations.
6. Session Filter & Anti-Churn Control
• Restrict trading hours (optional; not required for crypto).
• Prevents repeated signals and noise-based entries through minimum bars between trades.
• Cooldown logic ensures disciplined trading and avoids strategy overlap.
• Prevents multiple entries in a single bar and filters unconfirmed breakouts.
7. SmartMoney Preset Mode
• Institutional-grade configuration automatically adjusting volatility, ATR, and structural logic.
• Mimics smart money behavior by prioritizing clean structure and high liquidity volatility zones.
• Great for traders who want simplified institutional logic without manual tuning.
Optimized for 4H BTC & ETH
TitanEdge performs best on BTCUSDT and ETHUSDT pairs in the 4-hour timeframe.
The 4H chart captures high-volatility institutional swings, eliminates intraday noise, and provides clear order-block setups.
This timeframe aligns with BTC/ETH volatility cycles, providing consistent signals and cleaner trend confirmation.
Recommended settings for 4H charts:
• Levels Period: 25
• Volatility Filter: 20
• volatility oscillator Auto: disable ( it depend upon your plan test with Disable/enable)
• Volatility Method: BBWidth
• ATR Multiplier: 1.8
• ATR Stop %: 5
• SuperTrend ATR Length: 10
• SuperTrend Factor: 3
• ATR Mode: StopAndTrail
• Hold Bars: 1
• Volume Exit: Disable (Both)
• Session Filter: Off (Crypto runs 24/7)
Entry Logic
• Long Entry: Price breaks above resistance (pivot high), volatility above threshold, and optional SuperTrend confirmation.
• Short Entry: Price breaks below support (pivot low), volatility above threshold, and optional bearish SuperTrend confirmation.
• Additional Entry: Triggered by order-block gaps (smart money imbalances) in volatility expansion phases.
• Trades only when both direction and volatility align to ensure precision entries.
Exit Logic
• ATR Stop and Trail dynamically manage open trades.
• SuperTrend Flip forces exit on trend reversal.
• Volume Exit triggers when volume momentum drops or opposite spike occurs.
• Optional session close exit to flatten trades outside hours.
• Logic prevents premature exits with “Hold Bars” delay after entry.
Why You Need TitanEdge Algo Suite
• Trades only during high-volatility, strong-momentum phases — no false breakouts or choppy trades.
• ATR risk control automatically adjusts to each market’s volatility conditions.
• Identifies institutional order-blocks and clean breakouts for precise entries.
• SuperTrend filter adds directional bias, boosting win-rate consistency.
• Volume exit logic ensures profits are protected when market momentum fades.
• Works 24/7 across all major crypto pairs — fully automated and customizable.
• Built for 4H swing trades — fewer but higher-quality setups.
• Fully compatible with TradingView alerts and bot integration for hands-free execution.
How TitanEdge Makes Profit
• TitanEdge only trades during volatility expansion, when breakout continuation probability is statistically high.
• ATR dynamic stops prevent large losses by scaling protection according to real volatility.
• Trend filtering keeps positions aligned with major market flows.
• Order-block detection ensures entries are based on price structure rather than random signals.
• Volume-based exits secure profits early when momentum weakens.
• SmartMoney Preset provides optimal balance between trade frequency, accuracy, and drawdown control.
• The system compounds edge by maintaining trade discipline — fewer but stronger trades over time.
Delta Exchange Integration (TradingView Bot Ready)
TitanEdge is fully compatible with TradingView alert webhooks and can connect to Delta Exchange or any bot-supported broker.
Alert JSON message format:
{"symbol":"{{ticker}}","side":"{{strategy.order.action}}","qty":1,"trigger_time":"{{timenow}}","strategy_id":"code"}
qty 1 represent 1 lot so if you want to take trade with 5 lots or 0.05eth and write
{"symbol":"{{ticker}}","side":"{{strategy.order.action}}","qty":5,"trigger_time":"{{timenow}}","strategy_id":"code"}
Steps to automate:
Create an alert on TradingView using “Once Per Bar Close”.
Paste your bot or automation webhook URL.
Paste the JSON above as the message.
Configure your bot or API bridge (like PineConnector, AutoView, or WunderTrading) to route signals to Delta Exchange.
On Delta, use BTCUSD or ETHUSD Perpetual pairs with moderate leverage (3x–5x).
Enable Cross Margin for smooth drawdown handling.
Test first on Delta Testnet for safety.
Why 4H BTC & ETH Works Best
• 4H candles capture true volatility swings and filter lower-timeframe noise.
• Aligns with institutional liquidity cycles in BTC and ETH.
• ATR and volume-based stops perform optimally on larger bars.
• Smoother equity curve and less drawdown compared to intraday trading.
• Ideal for traders seeking structured, medium-term trades with high reward-to-risk.
Unique Edge
• Combines breakout, order-block, and volatility principles into one adaptive model.
• Incorporates volatility normalization (ATR/BBWidth) for multi-market adaptability.
• Dynamic ATR stops and trailing protect capital during unstable phases.
• Volume and trend exits create layered protection systems.
• 4H optimization eliminates noise and provides clear institutional alignment.
• SmartMoney preset auto-configures settings to mimic large-player behavior.
• Fully automated via webhooks — no manual execution required.
• Modular design lets you customize each component for different trading styles.
TradingView Bot Integration
TitanEdge is fully plug-and-play with all TradingView-compatible bots.
Each alert sends structured JSON data containing direction, symbol, and quantity, ready for execution on your connected broker.
You can route the data to:
• PineConnector (MT4/MT5 bridge)
• WunderTrading
• AutoView
• Custom Node/REST API handler
This makes TitanEdge a professional-grade strategy suitable for semi-automatic or fully automated crypto trading setups.
Professional Recommendations
• Timeframe: 4H
• Instruments: BTCUSDT, ETHUSDT
• Exchange: Delta Exchange (Perpetual Futures)
• Leverage: 3x–5x
• Session Filter: Off (crypto 24/7)
• Risk per trade: 0.5%–1% of total equity
• Alert Type: Once Per Bar Close
• Volatility Filter: 25–35 depending on market activity
• Always use realistic slippage and fees for backtests.
Summary
TitanEdge Algo Suite is a complete trading framework built to deliver institutional-quality precision with full automation support.
It captures powerful volatility expansions on 4H BTC and ETH charts using clean structure, adaptive stops, and directional trend filters.
Every feature — from entry logic to exits — is designed to protect capital and amplify performance through disciplined, volatility-aware execution.
TitanEdge is not just another script — it’s a professional-grade algorithm that combines volatility intelligence, structural precision, and adaptive risk control.
TitanEdge Algo Suite = Smart Logic × Trend Discipline × Adaptive Risk Control
Optimized for BTC & ETH on 4H charts. Built for traders who demand precision, control, and consistency.

Triple CCI Strategy MFI Confirmed [Skyrexio]Overview
Triple CCI Strategy MFI Confirmed leverages 3 different periods Commodity Channel Index (CCI) indicator in conjunction Money Flow Index (MFI) and Exponential Moving Average (EMA) to obtain the high probability setups. Fast period CCI is used for having the high probability to enter in the direction of short term trend, middle and slow period CCI are used for confirmation, if market now likely in the mid and long-term uptrend. MFI is used to confirm trade with the money inflow/outflow with the high probability. EMA is used as an additional trend filter. Moreover, strategy uses exponential moving average (EMA) to trail the price when it reaches the specific level. More information in "Methodology" and "Justification of Methodology" paragraphs. The strategy opens only long trades.
Unique Features
Dynamic stop-loss system: Instead of fixed stop-loss level strategy utilizes average true range (ATR) multiplied by user given number subtracted from the position entry price as a dynamic stop loss level.
Configurable Trading Periods: Users can tailor the strategy to specific market windows, adapting to different market conditions.
Four layers trade filtering system: Strategy utilizes two different period CCI indicators, MFI and EMA indicators to confirm the signals produced by fast period CCI.
Trailing take profit level: After reaching the trailing profit activation level scrip activate the trailing of long trade using EMA. More information in methodology.
Methodology
The strategy opens long trade when the following price met the conditions:
Fast period CCI shall crossover the zero-line.
Slow and Middle period CCI shall be above zero-lines.
Price shall close above the EMA. Crossover is not obligatory
MFI shall be above 50
When long trade is executed, strategy set the stop-loss level at the price ATR multiplied by user-given value below the entry price. This level is recalculated on every next candle close, adjusting to the current market volatility.
At the same time strategy set up the trailing stop validation level. When the price crosses the level equals entry price plus ATR multiplied by user-given value script starts to trail the price with EMA. If price closes below EMA long trade is closed. When the trailing starts, script prints the label “Trailing Activated”.
Strategy settings
In the inputs window user can setup the following strategy settings:
ATR Stop Loss (by default = 1.75)
ATR Trailing Profit Activation Level (by default = 2.25)
CCI Fast Length (by default = 14, used for calculation short term period CCI)
CCI Middle Length (by default = 25, used for calculation short term period CCI)
CCI Slow Length (by default = 50, used for calculation long term period CCI)
MFI Length (by default = 14, used for calculation MFI
EMA Length (by default = 50, period of EMA, used for trend filtering EMA calculation)
Trailing EMA Length (by default = 20)
User can choose the optimal parameters during backtesting on certain price chart.
Justification of Methodology
Before understanding why this particular combination of indicator has been chosen let's briefly explain what is CCI, MFI and EMA.
The Commodity Channel Index (CCI) is a momentum-based technical indicator that measures the deviation of a security's price from its average price over a specific period. It helps traders identify overbought or oversold conditions and potential trend reversals.
The CCI formula is:
CCI = (Typical Price − SMA) / (0.015 × Mean Deviation)
Typical Price (TP): This is calculated as the average of the high, low, and closing prices for the period.
Simple Moving Average (SMA): This is the average of the Typical Prices over a specific number of periods.
Mean Deviation: This is the average of the absolute differences between the Typical Price and the SMA.
The result is a value that typically fluctuates between +100 and -100, though it is not bounded and can go higher or lower depending on the price movement.
The Money Flow Index (MFI) is a technical indicator that measures the strength of money flowing into and out of a security. It combines price and volume data to assess buying and selling pressure and is often used to identify overbought or oversold conditions. The formula for MFI involves several steps:
1. Calculate the Typical Price (TP):
TP = (high + low + close) / 3
2. Calculate the Raw Money Flow (RMF):
Raw Money Flow = TP × Volume
3. Determine Positive and Negative Money Flow:
If the current TP is greater than the previous TP, it's Positive Money Flow.
If the current TP is less than the previous TP, it's Negative Money Flow.
4. Calculate the Money Flow Ratio (MFR):
Money Flow Ratio = Sum of Positive Money Flow (over n periods) / Sum of Negative Money Flow (over n periods)
5. Calculate the Money Flow Index (MFI):
MFI = 100 − (100 / (1 + Money Flow Ratio))
MFI above 80 can be considered as overbought, below 20 - oversold.
The Exponential Moving Average (EMA) is a type of moving average that places greater weight and significance on the most recent data points. It is widely used in technical analysis to smooth price data and identify trends more quickly than the Simple Moving Average (SMA).
Formula:
1. Calculate the multiplier
Multiplier = 2 / (n + 1) , Where n is the number of periods.
2. EMA Calculation
EMA = (Current Price) × Multiplier + (Previous EMA) × (1 − Multiplier)
This strategy leverages Fast period CCI, which shall break the zero line to the upside to say that probability of short term trend change to the upside increased. This zero line crossover shall be confirmed by the Middle and Slow periods CCI Indicators. At the moment of breakout these two CCIs shall be above 0, indicating that there is a high probability that price is in middle and long term uptrend. This approach increases chances to have a long trade setup in the direction of mid-term and long-term trends when the short-term trend starts to reverse to the upside.
Additionally strategy uses MFI to have a greater probability that fast CCI breakout is confirmed by this indicator. We consider the values of MFI above 50 as a higher probability that trend change from downtrend to the uptrend is real. Script opens long trades only if MFI is above 50. As you already know from the MFI description, it incorporates volume in its calculation, therefore we have another one confirmation factor.
Finally, strategy uses EMA an additional trend filter. It allows to open long trades only if price close above EMA (by default 50 period). It increases the probability of taking long trades only in the direction of the trend.
ATR is used to adjust the strategy risk management to the current market volatility. If volatility is low, we don’t need the large stop loss to understand the there is a high probability that we made a mistake opening the trade. User can setup the settings ATR Stop Loss and ATR Trailing Profit Activation Level to realize his own risk to reward preferences, but the unique feature of a strategy is that after reaching trailing profit activation level strategy is trying to follow the trend until it is likely to be finished instead of using fixed risk management settings. It allows sometimes to be involved in the large movements. It’s also important to make a note, that script uses another one EMA (by default = 20 period) as a trailing profit level.
Backtest Results
Operating window: Date range of backtests is 2022.04.01 - 2024.11.25. It is chosen to let the strategy to close all opened positions.
Commission and Slippage: Includes a standard Binance commission of 0.1% and accounts for possible slippage over 5 ticks.
Initial capital: 10000 USDT
Percent of capital used in every trade: 50%
Maximum Single Position Loss: -4.13%
Maximum Single Profit: +19.66%
Net Profit: +5421.21 USDT (+54.21%)
Total Trades: 108 (44.44% win rate)
Profit Factor: 2.006
Maximum Accumulated Loss: 777.40 USDT (-7.77%)
Average Profit per Trade: 50.20 USDT (+0.85%)
Average Trade Duration: 44 hours
These results are obtained with realistic parameters representing trading conditions observed at major exchanges such as Binance and with realistic trading portfolio usage parameters.
How to Use
Add the script to favorites for easy access.
Apply to the desired timeframe and chart (optimal performance observed on 2h BTC/USDT).
Configure settings using the dropdown choice list in the built-in menu.
Set up alerts to automate strategy positions through web hook with the text: {{strategy.order.alert_message}}
Disclaimer:
Educational and informational tool reflecting Skyrex commitment to informed trading. Past performance does not guarantee future results. Test strategies in a simulated environment before live implementation

The Truth Sniper: Breathing Edition**Overview**
This is a highly advanced trend-following strategy designed to filter out market noise ("Fakeouts") and manage risk using a dynamic "Breathing Ratchet" mechanism. It combines traditional trend analysis with institutional money flow logic to identify the true market direction.
**Key Features**
**1. The Conflict Zone (Gray Zone Filter)**
Most strategies fail during low-volume accumulation or distribution phases. This algorithm introduces a "Conflict Zone" logic:
* **True Rally (Green):** Price is above EMA50 AND Money Flow (VFI) is positive.
* **True Drop (Red):** Price is below EMA50 AND Money Flow (VFI) is negative.
* **Conflict (Gray Background):** When Price and Money Flow disagree (e.g., Price rising on negative volume), the background turns Gray. **Trading is disabled** in these zones to avoid bull/bear traps.
**2. Breathing Stop-Loss Mechanism (Volatility Adjusted)**
The Stop Loss isn't static. It "breathes" based on market heat (Volume/RSI):
* **High Heat (High Volatility):** The SL loosens its grip, moving towards the bottom of the Fibonacci zone to allow price fluctuation without premature exits.
* **Low Heat (Low Volatility):** The SL tightens aggressively towards the price to lock in profits during slow momentum.
**3. The Ratchet Lock (Slippage Prevention)**
To ensure maximum profit retention, the "Breathing" mechanism is governed by a **Ratchet Logic**:
* **For Longs:** The Stop Loss can ONLY move UP. If the "Breathing" calculation suggests lowering the stop (due to increased volatility), the Ratchet blocks it, keeping the SL at the highest historical level.
* **For Shorts:** The Stop Loss can ONLY move DOWN.
**4. Fibonacci Exit Zones**
Exits are calculated based on a 60-day dynamic High/Low lookback, creating "Zones" (0-23.6%, 23.6-38.2%, etc.) that the price must conquer. The SL trails these zones mechanically.
**Visual Guide**
* **Lime/Red Background:** Active Trade Zone (Confirmed Trend).
* **Gray Background:** Conflict Zone (Stay Out / Hold).
* **Purple 'X':** The exact price level where the Stop Loss was hit (Fixed marker).
* **Stepline:** The active Stop Loss level (Visible only during open trades).
**Disclaimer**
This script is for educational and research purposes only. Always manage your risk.

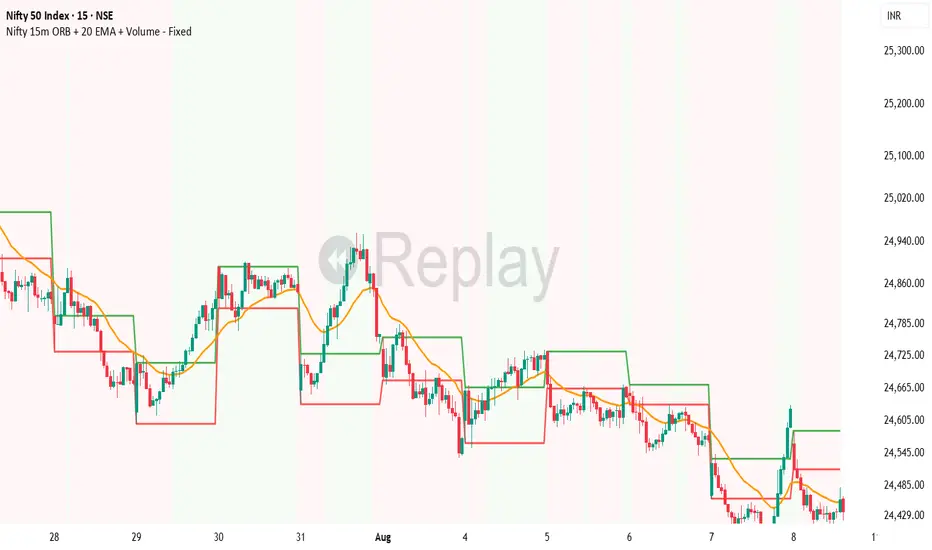
HARRISH DADE//@version=5
strategy("Nifty 15m ORB + 20 EMA + Volume - Signals Fixed", overlay=true,
initial_capital=100000, default_qty_type=strategy.percent_of_equity, default_qty_value=25,
process_orders_on_close=true)
// 15-minute timeframe check
if timeframe.period != "15"
runtime.error("Use this strategy on 15 minute timeframe only")
// ORB 9:15–9:30 High/Low
var float orbHigh = na
var float orbLow = na
newDay = ta.change(time("D")) != 0
if newDay
orbHigh := na
orbLow := na
sessStart = 0915
sessEnd = 0930
hhmm = hour * 100 + minute
inORB = hhmm >= sessStart and hhmm < sessEnd
if inORB
orbHigh := na(orbHigh) ? high : math.max(orbHigh, high)
orbLow := na(orbLow) ? low : math.min(orbLow, low)
// Plot ORB levels
plot(orbHigh, "ORB High", color=color.new(color.green, 0), linewidth=2)
plot(orbLow, "ORB Low", color=color.new(color.red, 0), linewidth=2)
// Trend filter - 20 EMA
emaLen = input.int(20, "EMA Length", minval=1)
ema20 = ta.ema(close, emaLen)
upTrend = close > ema20
dnTrend = close < ema20
plot(ema20, "EMA 20", color=color.orange, linewidth=2)
// Volume filter - Adaptive
volLen = input.int(20, "Volume MA Length", minval=1)
avgVol = ta.sma(volume, volLen)
volMult = input.float(1.5, "Volume Multiplier", step=0.1)
enoughVol = volume >= (avgVol * volMult)
// ORB complete check
orbLocked = not na(orbHigh) and not na(orbLow) and not inORB
// Entry conditions (for strategy)
longCond = orbLocked and ta.crossover(close, orbHigh) and upTrend and enoughVol
shortCond = orbLocked and ta.crossunder(close, orbLow) and dnTrend and enoughVol
// Risk Management
targetPts = input.float(40.0, "Target Points", step=1.0)
slPts = input.float(25.0, "Stoploss Points", step=1.0)
// STRATEGY ENTRIES
if longCond and strategy.position_size == 0
strategy.entry("LONG", strategy.long)
if shortCond and strategy.position_size == 0
strategy.entry("SHORT", strategy.short)
// STRATEGY EXITS
if strategy.position_size > 0
strategy.exit("LONG EXIT", from_entry="LONG",
limit=strategy.position_avg_price + targetPts,
stop=strategy.position_avg_price - slPts)
if strategy.position_size < 0
strategy.exit("SHORT EXIT", from_entry="SHORT",
limit=strategy.position_avg_price - targetPts,
stop=strategy.position_avg_price + slPts)
// **FIXED BUY/SELL SIGNALS** - No barstate.isconfirmed, direct conditions
plotshape(longCond, title="BUY", style=shape.triangleup, location=location.belowbar,
color=color.new(color.lime, 0), size=size.large, text="BUY", textcolor=color.white)
plotshape(shortCond, title="SELL", style=shape.triangledown, location=location.abovebar,
color=color.new(color.red, 0), size=size.large, text="SELL", textcolor=color.white)
// Debug table - shows if conditions met
if barstate.islast
var table debugTable = table.new(position.top_right, 2, 6, bgcolor=color.white, border_width=1)
table.cell(debugTable, 0, 0, "Condition", text_color=color.black, bgcolor=color.gray)
table.cell(debugTable, 1, 0, "Status", text_color=color.black, bgcolor=color.gray)
table.cell(debugTable, 0, 1, "ORB Locked", text_color=color.black)
table.cell(debugTable, 1, 1, str.tostring(orbLocked), text_color=orbLocked ? color.green : color.red)
table.cell(debugTable, 0, 2, "UpTrend", text_color=color.black)
table.cell(debugTable, 1, 2, str.tostring(upTrend), text_color=upTrend ? color.green : color.red)
table.cell(debugTable, 0, 3, "Enough Vol", text_color=color.black)
table.cell(debugTable, 1, 3, str.tostring(enoughVol), text_color=enoughVol ? color.green : color.red)
TrendSight📌 TrendSight — The All-in-One Multi-Timeframe Trend Engine
Key Features & Logic
Multi-Timeframe Trend Confirmation:
Entries are filtered by confirming bullish/bearish alignment across three distinct Supertrend timeframes (e.g., 5-min, 15-min, 45-min, etc.), combined with an EMA and volatility filter, to ensure high-conviction trades that's a powerful combination! Designing the entire strategy around the 15-minute timeframe (M15) and focusing on high-volatility coins maximizes the strategy's effectiveness .
Guaranteed Single-Entry per Signal:
The strategy uses a powerful manual flag and counter system to ensure trades fire only once when a new signal begins. It absolutely prevents immediate re-entry if the signal remains true, waiting instead for the entire trend condition to reset to false.
Dynamic Trailing Stop Loss:
The Stop Loss is set to a moving Supertrend line (current_supertrend), ensuring tight risk management that trails the price as the trade moves into profit.Guaranteed Take Profit (4% Run-up): Uses a precise Limit Order via strategy.exit() to capture profits instantly at a 4% run-up. This ensures accurate profit capture, even on sudden spikes (wicks).
Automated Risk Management:
Position size is dynamically calculated based on a fixed risk percentage (default 2% of equity) relative to the distance to the trailing stop.
🔥 Core Components
1. Adaptive Multi-Timeframe SuperTrend Dashboard
The backbone of mTrendSight is a fully customizable SuperTrend system, enhanced with a multi-timeframe confirmation table displaying ST direction & value.
This compact “Trend Dashboard” provides instant clarity on higher-timeframe direction, trend strength, and market bias.
2. Dynamic Support & Resistance Channels
Automatically detects the strongest support/resistance zones using pivot clustering.
Key Features:
Clustered S/R Channels instead of thin lines
Adaptive width based on recent swings
Breakout markers (optional) for continuation signals
Helps identify structural zones, retest areas, and liquidity pockets
3. Multi-Timeframe Color-Coded EMAs
Plot up to three EMAs, each optionally pulled from a higher timeframe.
Benefits:
Instant visual trend alignment
Bullish/Bearish dynamic color shifts
Precision EMA value table for trade planning
Works perfectly with ST & RSI for multi-layer confirmation
4. Linear Regression Trend Channel
A statistically driven trend channel that measures the most probable path of price action.
Highlights:
Uses Pearson’s R to determine trend reliability
Provides a Confidence Level to judge whether trend slope is credible
Ideal for determining over-extension and mean-reversion zones
5. ATR Volatility Analyzer
A lightweight but powerful volatility classifier using ATR.
Features:
Detects High, Low, or Normal volatility
Clean table display
Helps filter entries during low-energy markets
Strengthens trend-following filters when volatility expands
6. RSI Momentum & Trend Classifier
A significantly improved RSI with multi-layer smoothing and structure-based classification.
Provides:
Bullish / Bearish / Neutral momentum states
Short-term momentum vs long-term RSI trend
Perfect for early trend shifts, pullback entries, and momentum confirmation
⚙️ How the Strategy Works (Execution Logic)
📌 Multi-Timeframe Supertrend + EMA + Volatility Confirmation
Entries are only triggered when:
Multiple Supertrend timeframes align (e.g., 5m + 15m + 45m)
EMA direction aligns with the trend
Volatility conditions (ATR filter) is not Low allow high-probability moves
This ensures strong directional confluence before every trade.
📌 Guaranteed Single-Entry Logic
The strategy uses a flag + counter system to ensure:
Only one entry is allowed per trend signal
Re-entries do not happen until the entire trend condition resets
The Strategy Tester remains clean, without duplicate overlapping trades
This eliminates revenge trades, repeated fills, and choppy overtrading.
📌 Dynamic Supertrend Trailing Stop
Stop Loss is anchored to current Supertrend value, creating:
Automatic trailing
Tight downside control
Protection against deep pullbacks
High responsiveness during volatility expansions
📌 Precision Take-Profit (4% Run-Up Capture)
A dedicated global exit block ensures:
Take Profit triggers exactly at 4% price run-up
Uses strategy.exit() with limit orders to catch spikes (wicks)
Works consistently on all timeframes & assets
📌 Automated Position Sizing (2% Risk Default)
Position size is dynamically calculated based on:
Account Equity
Distance to trailing stop
Configured risk %
This enforces proper risk management without manual adjustments.
📈 How to Interpret Results
Reliable Exits: All exits are globally managed, so stops and take profits trigger accurately on every bar.
Clean Trade History: Because of single-entry logic, backtests show one trade per valid signal.
Consistency: Multi-timeframe logic ensures only high-quality, structured trades.

SMC Trend Filter Strategy (EMA50/EMA200 + FVG)Overview
This strategy implements a multi-timeframe Smart Money Concept (SMC) trading system designed for intraday and swing trading.
It combines a Daily trend filter, Break of Structure (BOS) detection, Order Block (OB) zones, Fair Value Gap (FVG) confirmation, and an ATR-based trailing stop system to achieve structured and rule-based entries.
The strategy is fully automated for backtesting and allows users to evaluate SMC concepts without repainting or discretionary interpretation.
- Core Components
1. Higher-Timeframe Trend Filter (Daily EMA50/EMA200)
The strategy retrieves D1 data and determines market direction using EMA50 and EMA200:
Uptrend → EMA50 > EMA200
Downtrend → EMA50 < EMA200
Trades are only taken in the direction of the Daily trend to avoid counter-trend setups.
2. Market Structure & Break of Structure (BOS)
The strategy identifies swing highs/lows and detects when price breaks beyond them:
Bullish BOS: price closes above previous swing high
Bearish BOS: price closes below previous swing low
This forms the foundation of SMC market structure recognition.
3. Order Block Zone (OB)
Upon detecting a BOS, the strategy marks the previous candle as a potential Order Block:
For bullish BOS → OB = previous candle’s high/low
For bearish BOS → OB = previous candle’s high/low
The OB zone is visualized using a semi-transparent box extended forward

Strategy Builder v1.0.0 [BigBeluga]🔵 OVERVIEW
The Strategy Builder combines advanced price-action logic, smart-money concepts, and volatility-adaptive momentum signals to automate high-quality entries and exits across any market. It blends trend recognition, market structure shifts, order block reactions, imbalance (FVG) signals, liquidity sweeps, candlestick confirmations, and oscillator-powered divergences into one cohesive engine.
Whether used as a full automation workflow or as a structured confirmation framework, this strategy provides a disciplined, rules-driven method to trade with logic — not emotion.
🔵 BACKTEST WINDOW CONTROL
This module allows you to restrict strategy execution to a specific historical period.
Ideal for performance isolation, regime testing, and forward-walk validation.
Limit Backtest Window
Enabling this option activates custom date filters for the backtest engine.
Start — Define the starting date & time for backtesting
End — Define the ending date & time for backtesting
Only trades and signals inside this window are executed
Reduces computation load on large datasets
Useful for testing specific market environments (e.g., bull cycles, crash periods, sideways regimes)
🔵 SIGNAL GLOSSARY (Advanced Technical Explanation)
Traders can build long and short setups using up to 6 configurable entry conditions for each direction.
Every condition can be set as Bullish or Bearish and mapped to any signal source — allowing deep customization
Below is the full internal logic overview of every signal available in the Strategy Builder.
Signals are based on trend models, volatility structures, liquidity logic, oscillator behavior, and market structure mapping.
Trend Signals (Low-Lag Trend Engine)
Uses a proprietary low-lag baseline + momentum gradient model to detect directional bias.
Trend Signal — Momentum breaks above/below adaptive trend baseline.
Trend Signal+ — Stronger trend confirmation using volatility-weighted momentum.
Trend Signal Any — Triggers when any bullish/bearish trend signal appears.
SmartBand & Retests (Adaptive Volatility Bands)
Dynamic envelope that contracts/expands with volatility & trend strength.
SmartBand Retest — Price retests dynamic band and rejects, confirming continuation.
ActionWave Signals (Impulse-Pullback Engine)
Tracks wave behavior, acceleration and deceleration in price.
ActionWave — Detects directional impulse strength vs pullback weakness.
ActionWave Cross — Momentum acceleration threshold crossed → trend ignition.
Magnet Signals (Liquidity Gravity + Mean Reversion Bias)
Detects zones where price is being drawn due to liquidity voids or imbalance.
Magnet — Trend and liquidity pressure align, creating directional “pull.”
MagnetBar Low Momentum — Low-volatility compression → pre-breakout condition.
Flow Trend (Directional Flow State + ATR Envelope)
Higher-timeframe bias confirmation + dynamic volatility filter.
FlowTrend — Confirms major directional bias (uptrend or downtrend).
FlowTrend Retest — Price tests HTF flow band and rejects → trend resume.
Voltix (Volatility Expansion Pulse)
Detects regime shift from quiet accumulation → trending expansion.
Voltix — Breakout volatility signature, trend acceleration trigger.
Candlestick Pattern (Algorithmic Price Action Recognition)
Auto-recognizes meaningful reversal or continuation candle formations.
Candlestick Pattern — Confirms momentum reversal/continuation via candle logic.
OrderBlock Logic (Institutional Footprint System)
Institutional demand/supply zone tracking with mitigation logic.
Order Block Touch — Price taps institutional zone → reaction filter.
Order Block Break — OB invalidation → institutional flow shift.
Market Structure Engine (Swing Logic + Volume Confirmation)
Tracks major swing breaks and structural reversals.
BoS — Break of Structure in trend direction (continuation bias).
ChoCh — Change of Character — early reversal marker.
Fair Value Gaps (Imbalance & Volume Displacement)
Identifies inefficiencies caused by rapid displacement moves.
FVG Created — Price leaves inefficiency behind.
FVG Retest — Price returns to rebalance inefficiency → reaction zone.
Liquidity Events (Stop-Run & Reversal Logic)
Detects stop-hunt events and liquidity sweeps.
SFP — Swing failure & wick sweep → reversal confirmation.
Liquidity Created — New equal highs/lows form liquidity pool.
Liquidity Grab — Sweep through liquidity line followed by rejection.
Support / Resistance Break Logic
Adaptive zone recognition + momentum confirmation.
Support/Resistance Cross — Zone decisively broken → structural shift.
Pattern Breakouts (Market Geometry Engine)
Tracks breakout from compression & expansion formations.
Channel Break — Channel breakout → trend acceleration.
Wedge Break — Break from contraction wedge → burst of momentum.
Session Logic (Opening Range Behavior)
Session-based volatility trigger.
Session Break — Break above/below session opening range.
Momentum / Reversal Oscillator Suite
Oscillator-driven exhaustion & reversal signals.
Nautilus Signals — Momentum reversal signature (oscillator shift).
Nautilus Peak — Momentum peak → exhaustion risk.
OverSold/Overbought ❖ — Extreme exhaustion zones → reversal setup.
DipX Signals ✦ — Dip buy / Dip sell timing, micro-reversal engine.
Advanced Divergence Engine
Momentum/price disagreement layer with multi-trigger confirmation.
Normal Divergence — Classic divergence reversal.
Hidden Divergence — Trend continuation divergence.
Multiple Divergence — Multiple divergence confirmations stacked → high confidence.
🔧 Adjustable Signal Logic
Some signals in this system can be additionally refined through the strategy settings panel.
This allows traders to tune internal behavior for different market regimes, assets, and volatility conditions.
🔵 LONG / SHORT EXIT CONDITIONS
This section allows you to automate exits using the same advanced market conditions available for entries.
Each exit rule consists of:
Toggle — Enable/disable individual exit rule.
Direction Filter — Trigger exit only if selected market bias appears (Bullish/Bearish).
Signal Type — Choose which market event triggers the exit (same list as entry conditions).
When the active conditions are met, the strategy automatically closes the current position — ensuring emotion-free risk management and systematic trade control.
🔵 TAKE PROFIT & STOP LOSS SYSTEM
This strategy builder provides a fully dynamic risk-management engine designed for both systematic traders and discretionary confirmation users.
Take Profit Logic
Scale out of trades progressively or exit fully using algorithmic TP levels.
Up to 3 Take-Profit targets available
Choose TP calculation method:
• ATR-based distance (volatility-adaptive targets)
• %-based distance (fixed percentage from entry)
Define Size — ATR multiplier or % value
Custom Exit Size per TP (e.g., 25% / 25% / 50%)
Visual TP plotting on chart for clarity
Stop Loss Logic
Automated protection logic for every trade.
Two SL Modes:
• Fixed Stop Loss — static SL from entry
• Trailing Stop Loss — SL follows price as trade progresses
Distance options:
• ATR multiplier (adapts to volatility)
• %-based from entry (fixed distance)
SL dynamically draws on chart for transparency
Trailing SL behavior:
Follows price only in profitable direction
Never moves against the trade
Locks profits as trend develops
🔵 Strategy Dashboard
A compact on-chart performance dashboard is included to help monitor live trade status and backtest results in real time.
It displays key metrics:
Start Capital — Initial account balance used in simulation.
Position Size — % of capital allocated per trade based on user settings (It changes if the trade hits take profits, when more than one take profit is selected).
Current Trade — Shows active trade direction (Long / Short) and real-time % return from entry.
Closed Trades — Counter of completed positions, useful for reading sample size during testing.
🔵 CONCLUSION
The Strategy Builder brings together a powerful suite of smart-money and momentum-driven signals, allowing traders to automate robust trade logic built on modern market structure concepts. With access to trend filters, order blocks, liquidity events, divergence signals, volatility cues, and session-based triggers, it provides a deeply adaptive trade engine capable of fitting many market environments.

Killzones SMT + IFVG detectorKillzones SMT + IFVG Detector
Summary
This strategy implements a specific intraday workflow inspired by ICT-style concepts.
It combines:
Killzone session levels (recording untouched highs/lows)
SMT divergence between NQ and ES (exclusive sweep logic)
IFVG confirmation (3-bar imbalance + width filter + inversion guard)
and an optional smart exit engine
The components are not simply mashed together: they interact in sequence.
A setup only confirms if all conditions line up (time window → untouched level sweep → divergence → valid IFVG → confirmation candle → risk filter).
Workflow
Killzones & session levels
Tracks highs/lows inside default killzones (19:00–23:00, 01:00–04:00, 08:30–10:00, 11:00–12:00, 12:30–15:00, chart timezone).
Stores untouched levels forward; sweeps trigger candidate signals.
SMT divergence (exclusive sweep)
Bullish SMT : one index sweeps its low while the other remains above its session low.
Bearish SMT : one index sweeps its high while the other remains below its session high.
Detection supports “Sweep (Cross)” or “Exact Tick.”
Session IDs are tracked so once a side has fired, later re-touches can’t re-trigger .
IFVG confirmation
Locks the first valid 3-bar IFVG after SMT.
Confirmation requires a candle close beyond the IFVG boundary in the direction of the close.
IFVGs must meet a minimum width filter (default 1.0 point).
Inversion guard: ignores IFVGs already inverted before SMT.
Optional “re-lock” keeps tracking the latest IFVG until confirmation/expiry.
Smart exit engine
Initial stop from opposite wick (+ buffer).
Fixed TP (default 40 points).
Dynamic stop escalation at progress thresholds (BE → 50% → 80% of target).
Safety gates
Weekend lockout (Fri 16:40 → Sun 18:00).
Same-bar sweep of high & low cancels setups.
Max initial stop filter skips oversized setups.
Optional cooldown bars.
Alerts
SMT Bullish/Bearish : divergence detected this bar.
Confirm Long/Short : IFVG confirmation triggered.
Default Strategy Properties (used in screenshots/backtests)
Initial capital: $25,000
Order size: 1 contract
Commission: $1.25 per contract per side
Slippage: 2 ticks
Backtest window: Jun 16, 2025 – Sep 14, 2025
These settings are intentionally conservative. If you change them, your results will differ.
How to use
Apply on an NQ or ES futures chart (1–5 min).
Choose your killzones and detection mode.
Select confirmation symbol (NQ, ES, or “Sweeper”).
Enable/disable IFVG re-lock.
Review signals and use alerts for automation if desired.
Limitations
Strict filters reduce trade count; extend backtest window for more samples.
Works best on NQ/ES; not validated elsewhere.
Past performance is not indicative of future results.
This is an educational tool ; not financial advice.

EMA and Dow Theory Strategies🌐 Strategy Description
📘 Overview
This is a hybrid strategy that combines EMA crossovers, Dow Theory swing logic, and multi-timeframe trend overlays. It is suitable for intraday to short-term trading on any asset class: crypto, forex, stocks, and indices.
The strategy provides precise entry/exit signals, dynamic stop-loss and scale-out, and highly visual trade guidance.
🧠 Key Features
・Dual EMA crossover system (applied to both symbol and external index)
・Dow Theory-based swing high/low detection for trend confirmation
・Visual overlay of higher timeframe swing trend (htfTrend)
・RSI filter to avoid overbought/oversold entries
・Dynamic partial take-profit when trend weakens
・Custom stop-loss (%) control
・Visualized trade PnL labels directly on chart
・Alerts for entry, stop-loss, partial exit
・Gradient background zones for swing zones and trend visualization
・Auto-tracked metrics: APR, drawdown, win rate, equity curve
⚙️ Input Parameters
| Parameter | Description |
| ------------------------- | -------------------------------------------------------- |
| Fast EMA / Slow EMA | Periods for detecting local trend via EMAs |
| Index Fast EMA / Slow EMA | EMAs applied to external reference index |
| StopLoss | Maximum loss threshold in % |
| ScaleOut Threshold | Scale-out percentage when trend changes color |
| RSI Period / Levels | RSI period and overbought/oversold levels |
| Swing Detection Length | Number of bars used to detect swing highs/lows |
| Stats Display Options | Toggle PnL labels and position of statistics table |
🧭 About htfTrend (Higher Timeframe Trend)
The script includes a higher timeframe trend (htfTrend) calculated using Dow Theory (pivot highs/lows).
This trend is only used for visual guidance, not for actual entry conditions.
Why? Strictly filtering trades by higher timeframe often leads to missed opportunities and low frequency.
By keeping htfTrend visual-only, traders can still refer to macro structure but retain trade flexibility.
Use it as a contextual tool, not a constraint.
ストラテジー説明
📘 概要
本ストラテジーは、EMAクロスオーバー、ダウ理論によるスイング判定、**上位足トレンドの視覚表示(htfTrend)**を組み合わせた複合型の短期トレーディング戦略です。
仮想通貨・FX・株式・指数など幅広いアセットに対応し、デイトレード〜スキャルピング用途に適しています。
動的な利確/損切り、視覚的にわかりやすいエントリー/イグジット、統計表示を搭載しています。
🧠 主な機能
・対象銘柄+外部インデックスのEMAクロスによるトレンド判定
・ダウ理論に基づいたスイング高値・安値検出とトレンド判断
・上位足スイングトレンド(htfTrend)の視覚表示
・RSIフィルターによる過熱・売られすぎの回避
・トレンドの弱まりに応じた部分利確(スケールアウト)
・**損切り閾値(%)**をカスタマイズ可能
・チャート上に損益ラベル表示
・アラート完備(エントリー・決済・部分利確)
・トレンドゾーンを可視化する背景グラデーション
・勝率・ドローダウン・APR・資産増加率などの自動表示
| 設定項目名 | 説明内容 |
| --------------------- | -------------------------- |
| Fast EMA / Slow EMA | 銘柄に対して使用するEMAの期間設定 |
| Index Fast / Slow EMA | 外部インデックスのEMA設定 |
| 損切り(StopLoss) | 損切りラインのしきい値(%で指定) |
| 部分利確しきい値 | トレンド弱化時にスケールアウトする割合(%) |
| RSI期間・水準 | RSI計算期間と、過熱・売られすぎレベル設定 |
| スイング検出期間 | スイング高値・安値の検出に使用するバー数 |
| 統計表示の切り替え | 損益ラベルや統計テーブルの表示/非表示選択 |
🧭 上位足トレンド(htfTrend)について
本スクリプトには、上位足でのスイング高値・安値の更新に基づく**htfTrend(トレンド判定)が含まれています。
これは視覚的な参考情報であり、エントリーやイグジットには直接使用されていません。**
その理由は、上位足を厳密にロジックに組み込むと、トレード機会の損失が増えるためです。
このスクリプトでは、**判断の補助材料として「表示のみに留める」**設計を採用しています。
→ 裁量で「利確を早める」「逆張りを避ける」判断に活用可能です。

QuantJazz Turbine Trader BETA v1.17QuantJazz Turbine Trader BETA v1.17 - Strategy Introduction and User Guide
Strategy Introduction
Welcome to the QuantJazz Turbine Trader BETA v1.17, a comprehensive trading strategy designed for TradingView. This strategy is built upon oscillator principles, drawing inspiration from the Turbo Oscillator by RedRox, and incorporates multiple technical analysis concepts including RSI, MFI, Stochastic oscillators, divergence detection, and an optional FRAMA (Fractal Adaptive Moving Average) filter.
The Turbine Trader aims to provide traders with a flexible toolkit for identifying potential entry and exit points in the market. It presents information through a main signal line oscillator, a histogram, and various visual cues like dots, triangles, and divergence lines directly on the indicator panel. The strategy component allows users to define specific conditions based on these visual signals to trigger automated long or short trades within the TradingView environment.
This guide provides an overview of the strategy's components, settings, and usage. Please remember that this is a BETA version (v1.17). While developed with care, it may contain bugs or behave unexpectedly.
LEGAL DISCLAIMER: QuantJazz makes no claims about the fitness or profitability of this tool. Trading involves significant risk, and you may lose all of your invested capital. All trading decisions made using this strategy are solely at the user's discretion and responsibility. Past performance is not indicative of future results. Always conduct thorough backtesting and risk assessment before deploying any trading strategy with real capital.
This work is licensed under Creative Commons Attribution-NonCommercial-ShareAlike 4.0 International.
Core Concepts and Visual Elements
The Turbine Trader indicator displays several components in its own panel below the main price chart:
1. Signal Line (Avg & Avg2): This is the primary oscillator. It's a composite indicator derived from RSI, MFI (Money Flow Index), and Stochastic calculations, smoothed using an EMA (Exponential Moving Average).
Avg: The faster smoothed signal line.
Avg2: The slower smoothed signal line.
Color Coding: The space between Avg and Avg2 is filled. The color (Neon Blue/gColor or Neon Purple/rColor) indicates the trend based on the relationship between Avg and Avg2. Blue suggests bullish momentum (Avg > Avg2), while Purple suggests bearish momentum (Avg2 > Avg).
Zero Line Crosses: Crossovers of the Avg line with the zero level can indicate shifts in momentum.
2. Histogram (resMfi): This histogram is based on smoothed and transformed MFI calculations (Fast MFI and Slow MFI).
Color Coding: Bars are colored Neon Blue (histColorUp) when above zero, suggesting bullish pressure, and Neon Purple (histColorDn) when below zero, suggesting bearish pressure. Transparency is applied.
Zero Line Crosses: Crossovers of the histogram with the zero level can signal potential shifts in money flow.
3. Reversal Points (Dots): Dots appear on the Signal Line (specifically on Avg2) when the color changes (i.e., Avg crosses Avg2).
Small Dots: Appear when a reversal occurs while the oscillator is in an "extreme" zone (below -60 for bullish reversals, above +60 for bearish reversals).
Large Dots: Appear when a reversal occurs outside of these extreme zones.
Colors: Blue (gRdColor) for bullish reversals (Avg crossing above Avg2), Purple (rRdColor) for bearish reversals (Avg crossing below Avg2).
4. Take Profit (TP) Signals (Triangles): Small triangles appear above (+120) or below (-120) the zero line.
Bearish Triangle (Down, Purple rTpColor): Suggests a potential exit point for long positions or an entry point for short positions, based on the oscillator losing upward momentum above the 50 level.
Bullish Triangle (Up, Blue gTpColor): Suggests a potential exit point for short positions or an entry point for long positions, based on the oscillator losing downward momentum below the -50 level.
5. Divergence Lines: The strategy automatically detects and draws potential regular and hidden divergences between the price action (highs/lows) and the Signal Line (Avg).
Regular Bullish Divergence (White bullDivColor line, ⊚︎ label): Price makes a lower low, but the oscillator makes a higher low. Suggests potential bottoming.
Regular Bearish Divergence (White bearDivColor line, ⊚︎ label): Price makes a higher high, but the oscillator makes a lower high. Suggests potential topping.
Hidden Bullish Divergence (bullHidDivColor line, ⊚︎ label): Price makes a higher low, but the oscillator makes a lower low. Suggests potential continuation of an uptrend.
Hidden Bearish Divergence (bearHidDivColor line, ⊚︎ label): Price makes a lower high, but the oscillator makes a higher high. Suggests potential continuation of a downtrend.
Delete Broken Divergence Lines: If enabled, newer divergence lines originating from a similar point will replace older ones.
6. Status Line: A visual bar at the top (95 to 105) and bottom (-95 to -105) of the indicator panel. Its color intensity reflects the confluence of signals:
Score Calculation: +1 if Avg > Avg2, +1 if Avg > 0, +1 if Histogram > 0.
Top Bar (Bullish): Bright Blue (gStatColor) if score is 3, Faded Blue if score is 2, Black otherwise.
Bottom Bar (Bearish): Bright Purple (rStatColor) if score is 0, Faded Purple if score is 1, Black otherwise.
Strategy Settings Explained
The strategy's behavior is controlled via the settings panel (gear icon).
1. Date Range:
Start Date, End Date: Define the period for backtesting. Trades will only occur within this range.
2. Optional Webhook Configuration: (For Automation)
3C Email Token, 3C Bot ID: Enter your 3Commas API credentials if you plan to automate trading using webhooks. The strategy generates JSON alert messages compatible with 3Commas. You can go ahead and just leave the text field as defaulted, "TOKEN HERE" / "BOT ID HERE" if not using any bot automations at this time. You can always come back later and automate it. More info can be made available from QuantJazz should you need automation assistance with custom indicators and trading strategies.
3. 🚀 Signal Line:
Turn On/Off: Show or hide the main signal lines (Avg, Avg2).
gColor, rColor: Set the colors for bullish and bearish signal line states.
Length (RSI): The lookback period for the internal RSI calculation. Default is 2.
Smooth (EMA): The smoothing period for the EMAs applied to the composite signal. Default is 9.
RSI Source: The price source used for RSI calculation (default: close).
4. 📊 Histogram:
Turn On/Off: Show or hide the histogram.
histColorUp, histColorDn: Set the colors for positive and negative histogram bars.
Length (MFI): The base lookback period for MFI calculations. Default is 5. Fast and Slow MFI lengths are derived from this.
Smooth: Smoothing period for the final histogram output. Default is 1 (minimal smoothing).
5.💡 Other:
Show Divergence Line: Toggle visibility of regular divergence lines.
bullDivColor, bearDivColor: Colors for regular divergence lines.
Show Hidden Divergence: Toggle visibility of hidden divergence lines.
bullHidDivColor, bearHidDivColor: Colors for hidden divergence lines.
Show Status Line: Toggle visibility of the top/bottom status bars.
gStatColor, rStatColor: Colors for the status line bars.
Show TP Signal: Toggle visibility of the TP triangles.
gTpColor, rTpColor: Colors for the TP triangles.
Show Reversal points: Toggle visibility of the small/large dots on the signal line.
gRdColor, rRdColor: Colors for the reversal dots.
Delete Broken Divergence Lines: Enable/disable automatic cleanup of older divergence lines.
6. ⚙️ Strategy Inputs: (CRITICAL for Trade Logic)
This section defines which visual signals trigger trades. Each signal (Small/Large Dots, TP Triangles, Bright Bars, Signal/Histogram Crosses, Signal/Histogram Max/Min, Divergences) has a dropdown menu:
Long: This signal can trigger a long entry.
Short: This signal can trigger a short entry.
Disabled: This signal will not trigger any entry.
Must Be True Checkbox: If checked for a specific signal, that signal's condition must be met for any trade (long or short, depending on the dropdown selection for that signal) to be considered. Multiple "Must Be True" conditions act as AND logic – all must be true simultaneously.
How it Works:
The strategy first checks if all conditions marked as "Must Be True" (for the relevant trade direction - long or short) are met.
If all "Must Be True" conditions are met, it then checks if at least one of the conditions not marked as "Must Be True" (and set to "Long" or "Short" respectively) is also met.
If both steps pass, and other filters (like Date Range, FRAMA) allow, an entry order is placed.
Example: If "Large Bullish Dot" is set to "Long" and "Must Be True" is checked, AND "Bullish Divergence" is set to "Long" but "Must Be True" is not checked: A long entry requires BOTH the Large Bullish Dot AND the Bullish Divergence to occur simultaneously. If "Large Bullish Dot" was "Long" but not "Must Be True", then EITHER a Large Bullish Dot OR a Bullish Divergence could trigger a long entry (assuming no other "Must Be True" conditions are active).
Note: By default, the strategy is configured for long-only trades (strategy.risk.allow_entry_in(strategy.direction.long)). To enable short trades, you would need to comment out or remove this line in the Pine Script code and configure the "Strategy Inputs" accordingly.
7. 💰 Take Profit Settings:
Take Profit 1/2/3 (%): The percentage above the entry price (for longs) or below (for shorts) where each TP level is set. (e.g., 1.0 means 1% profit).
TP1/2/3 Percentage: The percentage of the currently open position to close when the corresponding TP level is hit. The percentages should ideally sum to 100% if you intend to close the entire position across the TPs.
Trailing Stop (%): The percentage below the highest high (for longs) or above the lowest low (for shorts) reached after the activation threshold, where the stop loss will trail.
Trailing Stop Activation (%): The minimum profit percentage the trade must reach before the trailing stop becomes active.
Re-entry Delay (Bars): The minimum number of bars to wait after a TP is hit before considering a re-entry. Default is 1 (allows immediate re-entry on the next bar if conditions met).
Re-entry Price Offset (%): The percentage the price must move beyond the previous TP level before a re-entry is allowed. This prevents immediate re-entry if the price hovers around the TP level.
8. 📈 FRAMA Filter: (Optional Trend Filter)
Use FRAMA Filter: Enable or disable the filter.
FRAMA Source, FRAMA Period, FRAMA Fast MA, FRAMA Slow MA: Parameters for the FRAMA calculation. Defaults provided are common starting points.
FRAMA Filter Type:
FRAMA > previous bars: Allows trades only if FRAMA is significantly above its recent average (defined by FRAMA Percentage and FRAMA Lookback). Typically used to confirm strong upward trends for longs.
FRAMA < price: Allows trades only if FRAMA is below the current price (framaSource). Can act as a baseline trend filter.
FRAMA Percentage (X), FRAMA Lookback (Y): Used only for the FRAMA > previous bars filter type.
How it Affects Trades: If Use FRAMA Filter is enabled:
Long entries require the FRAMA filter condition to be true.
Short entries require the FRAMA filter condition to be false (as currently coded, this acts as an inverse filter for shorts if enabled).
How to Use the Strategy
1. Apply to Chart: Open your desired chart on TradingView. Click "Indicators", find "QuantJazz Turbine Trader BETA v1.17" (you might need to add it via Invite-only scripts or if published publicly), and add it to your chart. The oscillator appears below the price chart, and the strategy tester panel opens at the bottom.
2. Configure Strategy Properties: In the Pine Script code itself (or potentially via the UI if supported), adjust the strategy() function parameters like initial_capital, default_qty_value, commission_value, slippage, etc., to match your account, broker fees, and risk settings. The user preferences provided (e.g., 1000 initial capital, 0.1% commission) are examples. Remember use_bar_magnifier is false by default in v1.17.
3. Configure Inputs (Settings Panel):
Set the Date Range for backtesting.
Crucially, configure the ⚙️ Strategy Inputs. Decide which signals should trigger entries and whether they are mandatory ("Must Be True"). Start simply, perhaps enabling only one or two signals initially, and test thoroughly. Remember the default long-only setting unless you modify the code.
Set up your 💰 Take Profit Settings, including TP levels, position size percentages for each TP, and the trailing stop parameters. Decide if you want to use the re-entry feature.
Decide whether to use the 📈 FRAMA Filter and configure its parameters if enabled.
Adjust visual elements (🚀 Signal Line, 📊 Histogram, 💡 Other) as needed for clarity.
4. Backtest: Use the Strategy Tester panel in TradingView. Analyze the performance metrics (Net Profit, Max Drawdown, Profit Factor, Win Rate, Trade List) across different assets, timeframes, and setting configurations. Pay close attention to how different "Strategy Inputs" combinations perform.
5. Refine: Based on backtesting results, adjust the input settings, TP/SL strategy, and signal combinations to optimize performance for your chosen market and timeframe, while being mindful of overfitting.
6. Automation (Optional): If using 3Commas or a similar platform:
Enter your 3C Email Token and 3C Bot ID in the settings.
Create alerts in TradingView (right-click on the chart or use the Alert panel).
Set the Condition to "QuantJazz Turbine Trader BETA v1.17".
In the "Message" box, paste the corresponding placeholder, which will pass the message in JSON from our custom code to TradingView to pass through your webhook: {{strategy.order.alert_message}}.
In the next tab, configure the Webhook URL provided by your automation platform. Put a Whale sound, while you're at it! 🐳
When an alert triggers, TradingView will send the pre-formatted JSON message from the strategy code to your webhook URL.
Final Notes
The QuantJazz Turbine Trader BETA v1.17 offers a wide range of customizable signals and strategy logic. Its effectiveness heavily depends on proper configuration and thorough backtesting specific to the traded asset and timeframe. Start with the default settings, understand each component, and methodically test different combinations of signals and parameters. Remember the inherent risks of trading and never invest capital you cannot afford to lose.

3Commas Multicoin Scalper LITE [SwissAlgo]
Introduction
Are you tired of tracking cryptocurrency charts and placing orders manually on your Exchange?
The 3Commas Multicoin Scalper LITE is an automated trading system designed to identify and execute potential trading setups on multiple cryptocurrencies ( simultaneously ) on your preferred Exchange (Binance, Bybit, OKX, Gate.io, Bitget) via 3Commas integration.
It analyzes price action, volume, momentum, volatility, and trend patterns across two categories of USDT Perpetual coins: the 'Top Major Coins' category (11 established cryptocurrencies) and your Custom Category (up to 10 coins of your choice).
The indicator sends real-time trading signals directly to your 3Commas bots for automated execution, identifying both trend-following and contrarian trading opportunities in all market conditions.
Trade automatically all coins of one or more selected categories:
----------------------------------------------
What it Does
The 3Commas Multicoin Scalper LITE is a technical analysis tool that monitors multiple cryptocurrency pairs simultaneously and connects with 3Commas for signal delivery and execution.
Here's how the strategy works:
🔶 Technical Analysis : Analyzes price action, volume, momentum, volatility, and trend patterns across USDT Perpetual Futures contracts simultaneously.
🔶 Pattern Detection : Identifies specific candle patterns and technical confluences that suggest potential trading setups across USDT.P contracts of the selected category.
🔶 Signal Generation : When technical criteria are met at bar close, the indicator creates deal-start signals for the relevant pairs.
🔶 3Commas Integration : Packages these signals and delivers them to 3Commas through TradingView alerts, allowing 3Commas bots to receive specific pair information ('Deal-Start' signals).
🔶 Category Management : Each TradingView alert monitors an entire category, allowing selective activation of different crypto categories.
🔶 Visual Feedback : Provides color-coded candles and backgrounds to visualize technical conditions, with optional pivot points and trend visualization.
Candle types
Signals
----------------------------------------------
Quick Start Guide
1. Setup 3Commas Bots : Configure two DCA bots in 3Commas (All USDT pairs) - one for LONG positions and one for SHORT positions.
2. Define Trading Parameters : Set your budget for each trade and adjust your preferred sensitivity within the indicator settings.
3. Create Category Alerts : Set up one TradingView alert for each crypto category you want to trade.
That's it! Once configured, the system automatically sends signals to your 3Commas bots when predefined trading setups are detected across coins in your selected/activated categories. The indicator scans all coins at bar close (for example, every hour on the 1H timeframe) and triggers trade execution only for those showing technical confluences.
Important : Consider your total capital when enabling categories. More details about the setup process are provided below (see paragraph "Detailed Setup & Configuration").
----------------------------------------------
Built-in Backtesting
The 3Commas Multicoin Scalper LITE includes backtesting visualization for each coin. When viewing any USDT Perpetual pair on your chart, you can visualize how the strategy would have performed historically on that specific asset.
Color-coded candles and signal markers show past trading setups, helping you evaluate which coins responded best to the strategy. This built-in backtesting capability can support your selection of assets/categories to trade before deploying real capital.
As backtesting results are hypothetical and do not guarantee future performance, your research and analysis are essential for selecting the crypto categories/coins to trade.
The default strategy settings are: Start Capital 1,000$, leverage 10X, Commissions 0.1% (average Taker Fee on Exchanges for average users), Order Amount 200$ for Longs/Shorts, Slippage 4
Example of backtesting view
----------------------------------------------
Key Features
🔶 Multi-Exchange Support : Compatible with BINANCE, BYBIT, BITGET, GATEIO, and OKX USDT Perpetual markets (USDT.P)
🔶 Category Options : Analyze cryptocurrencies in the Top Major Coins category or create your custom watchlist
🔶 Custom Category Option : Create your watchlist with up to 10 custom USDT Perpetual pairs
🔶 3Commas Integration : Seamlessly connects with 3Commas bots to automate trade entries and exits
🔶 Dual Strategy Approach : Identifies both "trend following" and "contrarian" potential setups
🔶 Confluence-Based Signals : Uses a combination of multiple technical factors - price spikes, price momentum, volume spikes, volume momentum, trend analysis, and volatility spikes - to generate potential trading setups
🔶 Risk Management : Adjustable sensitivity/risk levels, leverage settings, and budget allocation for each trade
🔶 Visual Indicators : Color-coded candles and trading signals provide visual feedback on market conditions
🔶 Trend Indication : Background colors showing ongoing uptrends/downtrends
🔶 Pivot Points & Daily Open : Optional display of pivot points and daily open price for additional context
🔶 Liquidity Analysis : Optional display of high/low liquidity timeframes throughout the trading week
🔶 Trade Control : Configurable limit for the maximum number of signals sent to 3Commas for execution (per bar close and category)
5 Available Exchanges
Pick coins/tokens and defined your Custom Category
----------------------------------------------
Methodology
The 3Commas Multicoin Scalper LITE utilizes a multi-faceted approach to identify potential trading setups:
1. Price Action Analysis : Detects abnormal price movements by comparing the current candle's range to historical averages and standard deviations, helping identify potential "pump and dump" scenarios or new-trends start
2. Price Momentum : Evaluates the relative strength of bullish vs. bearish price movements over time, indicating the build-up of buying or selling pressure.
3. Volume Analysis: Identifies unusual volume spikes by comparing current volume to historical averages, signaling strong market interest in a particular direction.
4. Volume Momentum : Measures the ratio of bullish to bearish volume, revealing the dominance of buyers or sellers over time.
5. Trend Analysis : Combines EMA slopes, RSI, and Stochastic RSI to determine overall trend direction and strength.
6. Volatility : Monitors the ATR (Average True Range) to detect periods of increased market volatility, which may indicate potential breakouts or reversals
7. Candle Wick Analysis : Evaluates upper and lower wick percentages to detect potential rejection patterns and reversals.
8. Pivot Point Analysis : Uses pivot points (PP, R1-R3, S1-S3) for identifying key support/resistance areas and potential breakout/breakdown levels.
9. Daily Open Reference: Analyzes price action relative to the daily open for potential setups related to price movement vs. the opening price
10. Market Timing/Liquidity : Evaluates high/low liquidity periods, specific days/times of heightened risk, and potential market manipulation timeframes.
11. Boost Factors : Applies additional weight to certain confluence patterns to adjust global scores
These factors are combined into a "Global Score" ranging from -1 to +1 , applied at bar close to the newly formed candles.
Scores above predefined thresholds (configurable via the Sensitivity Settings) indicate strong bullish or bearish conditions and trigger signals based on predefined patterns. The indicator then applies additional filters to generate specific "Trend Following" and "Contrarian" trading signals. The identified signals are packaged and sent to 3Commas for execution.
Pivot Points
Trend Background
----------------------------------------------
Who This Strategy Is For
The 3Commas Multicoin Scalper LITE may benefit:
Crypto Traders seeking to automate their trading across multiple coins simultaneously
3Commas Users looking to enhance their bot performance with technical signals
Busy Traders who want to monitor market opportunities without constant chart-watching
Multi-strategy traders interested in both trend-following and reversal trading approaches
Traders of Various Experience Levels from intermediate traders wanting to save time to advanced traders seeking to optimize their operations
Perpetual Futures Traders on major exchanges (Binance, Bybit, OKX, Gate.io, Bitget)
Swing and Scalp Traders seeking to identify short to medium-term profit opportunities
----------------------------------------------
Visual Indicators
The indicator provides visual feedback through:
1. Candlestick Colors :
* Lime: Strong bullish candle (High positive score)
* Blue: Moderate bullish candle (Medium positive score)
* Red: Strong bearish candle (High negative score)
* Purple: Moderate bearish candle (Medium negative score)
* Pale Green/Red: Mild bullish/bearish candle
2. Signal Markers :
* ↗: Trend following Long signal
* ↘: Trend following Short signal
* ⤴: Contrarian Long signal
* ⤵: Contrarian Short signal
3. Optional Elements :
* Pivot Points: Daily support/resistance levels (R1-R3, S1-S3, PP)
* Daily Open: Reference price level for the current trading day
* Trend Background: Color-coded background suggesting potential ongoing uptrend/downtrend
* Liquidity Highlighting: Background colors indicating typical high/low market liquidity periods
4. TradingView Strategy Plots and Backtesting Data : Standard performance metrics showing entry/exit points, equity curves, and trade statistics, based on the signals generated by the script.
----------------------------------------------
Detailed Setup & Configuration
The indicator features a user-friendly input panel organized in sequential steps to guide you through the complete setup process. Tooltips for each step provide additional information to help you understand the actions required to get the strategy running.
Informative tables provide additional details and instructions for critical setup steps such as 3Commas bot configuration and TradingView alert creation (to activate trading on specific categories).
1. Choose Exchange, Crypto Category & Sensitivity
* Select your USDT Perpetual Exchange (BINANCE, BYBIT, BITGET, GATEIO, or OKX) - i.e. the same Exchange connected in your 3Commas account
* Choose your preferred crypto category, or define your watchlist
* Choose from three sensitivity levels: Default, Aggressive, or Test Mode (test mode is designed to generate more signals, a potentially helpful feature when you are testing the indicator and alerts)
2. Setup 3Commas Bots and integrate them with the algo
* Create both LONG and SHORT DCA Bots in 3Commas
* Configure bots to accept signals for 'All USDT Pairs' with "TradingView Custom Signal" as deal start condition
* Enter your Bot IDs and Email Token in the indicator settings
* Set a maximum budget for LONG and SHORT trades
* Choose whether to allow LONG trades, SHORT trades, or both, according to your preference and market analysis
* Set maximum trades per bar/category (i.e. the max. number of simultaneous signals that the algo may send to your 3Commas bots for execution at every bar close - every hour if you set the 1H timeframe)
* Access the detailed setup guide table for step-by-step 3Commas configuration instructions
3Commas integration
3. Choose Visuals
* Toggle various optional visual elements to add to the chart: category metrics, fired alerts, coin metrics, daily open, pivot points
* Select a color theme: Dark or Light
4. Activate Trading via Alerts
* Create TradingView alerts for each category you want to trade
* Set alert condition to "3Commas Multicoin Scalper" with "Any alert() function call"
* Set the content of the message field to: {{Message}}, deleting the default content shown in this text field, to enable proper 3Commas integration (any other text than {{Message}}, would break the delivery trading signals from Tradingview to 3Commas)
* View the alerts setup instruction table for visual guidance on this critical step
Alerts
Fired Alerts (example at a single bar)
Fired Alerts (frequency)
Important Configuration Notes
Ensure that the TradingView chart's exchange matches your selected exchange in the indicator settings and your 3Commas bot settings.
You must configure the same leverage in both the script and your 3Commas bots
Your 3Commas bots must be configured for All USDT pairs
You must enter the exact Bot IDs and Email Token from 3Commas (these remain confidential - no one, including us, has access to them)
If you activate multiple categories without sufficient capital, 3Commas will display " insufficient funds " errors - align your available capital with the number of categories you activate (each deal will use the budget amount specified in user inputs)
You are free to set your Take Profit % / trailing on 3Commas
We recommend not to use DCA orders (i.e. set the number of DCA orders at zero)
Legend of symbols and plots on the chart
----------------------------------------------
FAQs
General Questions
❓ Q: What features are included in this indicator? A: This indicator provides access to the "Top Major Coins" category and a custom category option where you can define up to 10 pairs of your choice. It includes multi-exchange support, 3Commas integration, a dual strategy approach, visual indicators, trade controls, and comprehensive backtesting capabilities. The indicator is optimized to manage up to 2 trades per hour/category with leverage up to 10x and trade sizes up to 500 USDT - everything needed for traders looking to automate their crypto trading across multiple pairs simultaneously.
❓ Q: What is Global Score? A: The Global Score serves as a foundation for signal generation. When a candle's score exceeds certain thresholds (defined by your Risk Level setting), it becomes a candidate for signal generation. However, not all high-scoring candles generate trading signals - the indicator applies additional pattern recognition and contextual filters. For example, a strongly positive score (lime candle) in an established uptrend may trigger a "Trend Following" signal, while a strongly negative score (red candle) in a downtrend might generate a "Trend following Short" signal. Similarly, contrarian signals are generated when specific reversal patterns occur alongside appropriate Global Score values, often involving wick analysis and pivot point interactions. This multi-layer approach helps filter out false positives and identify higher-probability trading setups.
❓ Q: What's the difference between "Trend following" and "Contrarian" signals in the script? A: "Trend Following" signals follow the identified trends while "Contrarian" signals anticipate potential trend reversals.
❓ Q: Why don't I see any signals on my chart? A: Make sure you're viewing a USDT Perpetual pair from your selected exchange that belongs to the crypto category you've chosen to analyze. For example, if you've selected the "Top Major Coins" category with Binance as your exchange, you need to view a chart of one of those specific pairs (like BINANCE:BTCUSDT.P) to see signals. If you switch exchanges, for example from Binance to Bybit, you need to pull a Bybit pair on the chart to see backtesting data and signals.
❓ Q: Does this indicator guarantee profits? A: No. Trading cryptocurrencies involves significant risk, and past performance is not indicative of future results. This indicator is a tool to help you identify potential trading setups, but it does not and cannot guarantee profits.
❓ Q: Does this indicator repaint or use lookahead bias? A: No. All trading signals generated by this indicator are based only on completed price data and do not repaint. The system is designed to ensure that backtesting results reflect as closely as possible what you should experience in live trading.
While reference levels like pivot points are kept stable throughout the day using lookahead on, the actual buy and sell signals are calculated using only historical data (lookahead off) that would have been available at that moment in time. This ensures reliability and consistency between backtesting and real-time trading performance.
Technical Setup
❓ Q: What exchanges are supported? A: The strategy supports BINANCE, BYBIT, BITGET, GATEIO, and OKX USDT Perpetual markets (i.e. all the Exchanges you can connect to your 3Commas account for USDT Perpetual trading, excluding Coinbase Perpetual that offers USDC pairs, instead of USDT).
❓ Q: What timeframe should I use? A: The indicator is optimized for the 1-hour (1H) timeframe but may run on any timeframe.
❓ Q: How many coins can I trade at once? A: You can trade all coins within the selected category. You can activate categories by setting up alerts.
❓ Q: How many alerts do I need to set up? A: You need to set up one alert for each crypto category you want to trade. We recommend starting with one category, testing the results carefully, monitoring performance daily, and perhaps activating additional categories in a second stage.
❓ Q: Are there any specific risk management features built into the indicator? A: Yes, the indicator includes risk management features: adjustable maximum trades per hour/category, the ability to enable/disable long or short signals depending on market conditions, customizable trade size for both long and short positions, and different sensitivity/risk level settings.
❓ Q: What happens if 3Commas can't execute a signal? A: If 3Commas cannot execute a signal (due to insufficient funds, bot offline, etc.), the trade will be skipped. The indicator will continue sending signals for other valid setups, but it doesn't retry failed signals.
❓ Q: Can I run this indicator on multiple charts at once? A: Yes, but it's not necessary. The indicator analyzes all coins in your selected categories regardless of which chart you apply it to. For optimal resource usage, apply it to a single chart of a USDT Perpetual pair from your selected exchange. To stop trading a category, simply delete the alert created for that category.
❓ Q: How frequently does the indicator scan for new signals? A: The indicator scans all coins in your selected categories at the close of each bar (every hour if you selected the 1H timeframe).
----------------------------------------------
⚠️
Disclaimer
This indicator is for informational and educational purposes only and does not constitute financial advice. Trading cryptocurrencies involves significant risk, including the potential loss of all invested capital, and past performance is not indicative of future results.
Always conduct your own thorough research (DYOR) and understand the risks involved before making any trading decisions. Trading with leverage significantly amplifies both potential profits and losses - exercise extreme caution when using leverage and never risk more than you can afford to lose.
The Bot ID and Email Token information are transmitted directly from TradingView to 3Commas via secure connections. No third party or entity will ever have access to this data (including the Author). Do not share your 3Commas credentials with anyone.
This indicator is not affiliated with, endorsed by, or sponsored by TradingView or 3Commas.

IronBot v4IronBot v4 – Trading Strategy Overview
1. Quick Context
IronBot v4 is a trading strategy designed for users who want a simple yet effective approach to reading the markets. It uses a combination of Fibonacci retracement levels, custom logic triggers, and innovative modules (EMA validation, Iron Impulse Shield and Iron Auto Volume Detector) to identify potential entry and exit points, strengthening the strategy’s detection of sudden market volatility or shifts in trading volume.
2. Theoretical Details
Fibonacci Analysis
The script identifies recent market highs and lows, then calculates key Fibonacci levels (high- and low-based). These levels can help confirm potential reversals or trends.
EMA Option
When enabled, the exponential moving average (EMA) offers additional validation for trade entries. If the current price remains above a certain EMA threshold, long positions may be favored; conversely, if it stays below the EMA, short positions may be initiated.
IIS (Iron Impulse Shield)
IIS helps to filter out risky trades by measuring recent price shocks or surges. If an extreme movement is detected, the strategy may temporarily disable longs or shorts to avoid false signals.
IAVD (Iron Auto Volume Detector)
This functionality automatically detects the average market volume over a defined period (regardless of the market, since it relies on real data). When entering a position, it ensures that overall volume is high enough to confirm a genuinely active, robust market. By providing an additional filter, it can strengthen the decision-making process whenever the market’s participation level is in question.
Panel
IronBot v4 displays a real-time backtest panel that summarizes the selected configuration (including the current pair, analysis window, enabled filters), as well as showing net profit, applicable exchange fees, country taxes, and the final net balance. This gives traders an immediate overview of strategy performance and risk metrics.
What Pinescript Adds Visually
The script plots:
Fibonacci levels (highlighting potential reversal zones)
Trend lines indicating bullish (green) or bearish (red) lean
Optional EMA line
Optional Fibonacci forecast lines for anticipating future moves
Automatic labeling of entry, take-profit, and stop-loss levels, indicating the profit percentage of each trade.
3. Explanation of Inputs
The strategy exposes multiple inputs that can be toggled or configured by the user:
Analysis Window : Dictates how many bars to consider for high/low calculations and the fib retracement thresholds.
TRADES
Display TP/SL: For displaying Take profits and Stop loss.
Display Forecast: When enabled, this feature calculates and projects possible future Fibonacci retracements using historical data, helping traders anticipate potential upcoming trade setups.
Leverage: Only used for the Panel and not for trades. Lets you amplify your position size; higher leverage increases potential gains but also heightens risk. TradingView strategy is using properties for doing this.
Exchange Maker Fees & Exchange Taker Fees: Only used for the Panel and not for trades. Define the percentage cost applied by your exchange for maker and taker trades, respectively. These fees are accounted for in final profit calculations of the Panel.
Country Tax: Only used for the Panel and not for trades. Specifies a tax percentage to be deducted from net profits.
STOP LOSS and TAKE PROFITS
Stop-Loss & Take-Profit Parameters: Controls the percentage distances at which the strategy will exit positions. Additionally, you can configure up to four distinct take-profit levels (TP1 through TP4). Each level should be higher target than the previous one, and you can assign a specific percentage of the total position to close at each TP, ensuring the sum equals 100%. A break-even feature is also available when multiple TPs are used.
EMA
EMA (Exponential Moving Average) Option: When enabled, the strategy opens long trades only if the current price is above the specified EMA length, and opens short trades only if it is below that threshold.
PANELS
Show Panel: For displaying the backtest integrated panel.
IRON IMPULSE SHIELD (IIS)
IIS (Iron Impulse Shield) Option: When enabled, IIS continuously monitors recent price volatility depending on the analysis window set. If the market experiences an extreme surge or drop beyond a specified threshold, IIS temporarily blocks new long or short positions.
IRON AUTO VOLUME DETECTOR (IAVD)
IAVD (Iron Auto Volume Detector) Option: When enabled, it continuously measures the average market volume over a special period, irrespective of the specific trading pair. This ensures that IronBot v4 focuses on markets with robust participation, reducing the likelihood of entering trades during low-liquidity conditions.
By changing these values, IronBot v4 reacts differently to market structure and risk management requirements. Stop-loss and take-profit levels will adjust accordingly, while advanced filters (like EMA or IIS) influence when trades can open.
4. TradingView Strategy Properties
IronBot v4 uses the built-in TradingView “strategy” functionality. In particular:
Order Placement: The code calls strategy.entry() and strategy.close() for direct orders, ensuring signals are sent immediately (no limit orders are used). This helps connect with exchange signal bots for automated execution.
Initial Capital: The code uses initial capital defined in properties for calculating Net balance in the integrated panel.
On bar close: This strategy fill orders on bar close.
Pyramiding: This strategy can take only 1 successive trade in the same direction
Be careful to configure your leverage input depending on your strategy properties.
5. Visualization
5. Purpose & Disclaimer
This script is for educational purposes only and does not constitute financial advice. Past performance does not guarantee future results. Always confirm your own risk tolerance and consult a financial professional before placing live trades. Trading leveraged products can involve substantial risk of loss.

Fibonacci ATR Fusion - Strategy [presentTrading]Open-script again! This time is also an ATR-related strategy. Enjoy! :)
If you have any questions, let me know, and I'll help make this as effective as possible.
█ Introduction and How It Is Different
The Fibonacci ATR Fusion Strategy is an advanced trading approach that uniquely integrates Fibonacci-based weighted averages with the Average True Range (ATR) to identify and capitalize on significant market trends.
Unlike traditional strategies that rely on single indicators or static parameters, this method combines multiple timeframes and dynamic volatility measurements to enhance precision and adaptability. Additionally, it features a 4-step Take Profit (TP) mechanism, allowing for systematic profit-taking at various levels, which optimizes both risk management and return potential in long and short market positions.
BTCUSD 6hr Performance
█ Strategy, How It Works: Detailed Explanation
The Fibonacci ATR Fusion Strategy utilizes a combination of technical indicators and weighted averages to determine optimal entry and exit points. Below is a breakdown of its key components and operational logic.
🔶 1. Enhanced True Range Calculation
The strategy begins by calculating the True Range (TR) to measure market volatility accurately.
TR = max(High - Low, abs(High - Previous Close), abs(Low - Previous Close))
High and Low: Highest and lowest prices of the current trading period.
Previous Close: Closing price of the preceding trading period.
max: Selects the largest value among the three calculations to account for gaps and limit movements.
🔶 2. Buying Pressure (BP) Calculation
Buying Pressure (BP) quantifies the extent to which buyers are driving the price upwards within a period.
BP = Close - True Low
Close: Current period's closing price.
True Low: The lower boundary determined in the True Range calculation.
🔶 3. Ratio Calculation for Different Periods
To assess the strength of buying pressure relative to volatility, the strategy calculates a ratio over various Fibonacci-based timeframes.
Ratio = 100 * (Sum of BP over n periods) / (Sum of TR over n periods)
n: Length of the period (e.g., 8, 13, 21, 34, 55).
Sum of BP: Cumulative Buying Pressure over n periods.
Sum of TR: Cumulative True Range over n periods.
This ratio normalizes buying pressure, making it comparable across different timeframes.
🔶 4. Weighted Average Calculation
The strategy employs a weighted average of ratios from multiple Fibonacci-based periods to smooth out signals and enhance trend detection.
Weighted Avg = (w1 * Ratio_p1 + w2 * Ratio_p2 + w3 * Ratio_p3 + w4 * Ratio_p4 + Ratio_p5) / (w1 + w2 + w3 + w4 + 1)
w1, w2, w3, w4: Weights assigned to each ratio period.
Ratio_p1 to Ratio_p5: Ratios calculated for periods p1 to p5 (e.g., 8, 13, 21, 34, 55).
This weighted approach emphasizes shorter periods more heavily, capturing recent market dynamics while still considering longer-term trends.
🔶 5. Simple Moving Average (SMA) of Weighted Average
To further smooth the weighted average and reduce noise, a Simple Moving Average (SMA) is applied.
Weighted Avg SMA = SMA(Weighted Avg, m)
- m: SMA period (e.g., 3).
This smoothed line serves as the primary signal generator for trade entries and exits.
🔶 6. Trading Condition Thresholds
The strategy defines specific threshold values to determine optimal entry and exit points based on crossovers and crossunders of the SMA.
Long Condition = Crossover(Weighted Avg SMA, Long Entry Threshold)
Short Condition = Crossunder(Weighted Avg SMA, Short Entry Threshold)
Long Exit = Crossunder(Weighted Avg SMA, Long Exit Threshold)
Short Exit = Crossover(Weighted Avg SMA, Short Exit Threshold)
Long Entry Threshold (T_LE): Level at which a long position is triggered.
Short Entry Threshold (T_SE): Level at which a short position is triggered.
Long Exit Threshold (T_LX): Level at which a long position is exited.
Short Exit Threshold (T_SX): Level at which a short position is exited.
These conditions ensure that trades are only executed when clear trends are identified, enhancing the strategy's reliability.
Previous local performance
🔶 7. ATR-Based Take Profit Mechanism
When enabled, the strategy employs a 4-step Take Profit system to systematically secure profits as the trade moves in the desired direction.
TP Price_1 Long = Entry Price + (TP1ATR * ATR Value)
TP Price_2 Long = Entry Price + (TP2ATR * ATR Value)
TP Price_3 Long = Entry Price + (TP3ATR * ATR Value)
TP Price_1 Short = Entry Price - (TP1ATR * ATR Value)
TP Price_2 Short = Entry Price - (TP2ATR * ATR Value)
TP Price_3 Short = Entry Price - (TP3ATR * ATR Value)
- ATR Value: Calculated using ATR over a specified period (e.g., 14).
- TPxATR: User-defined multipliers for each take profit level.
- TPx_percent: Percentage of the position to exit at each TP level.
This multi-tiered exit strategy allows for partial position closures, optimizing profit capture while maintaining exposure to potential further gains.
█ Trade Direction
The Fibonacci ATR Fusion Strategy is designed to operate in both long and short market conditions, providing flexibility to traders in varying market environments.
Long Trades: Initiated when the SMA of the weighted average crosses above the Long Entry Threshold (T_LE), indicating strong upward momentum.
Short Trades: Initiated when the SMA of the weighted average crosses below the Short Entry Threshold (T_SE), signaling robust downward momentum.
Additionally, the strategy can be configured to trade exclusively in one direction—Long, Short, or Both—based on the trader’s preference and market analysis.
█ Usage
Implementing the Fibonacci ATR Fusion Strategy involves several steps to ensure it aligns with your trading objectives and market conditions.
1. Configure Strategy Parameters:
- Trading Direction: Choose between Long, Short, or Both based on your market outlook.
- Trading Condition Thresholds: Set the Long Entry, Short Entry, Long Exit, and Short Exit thresholds to define when to enter and exit trades.
2. Set Take Profit Levels (if enabled):
- ATR Multipliers: Define how many ATRs away from the entry price each take profit level is set.
- Take Profit Percentages: Allocate what percentage of the position to close at each TP level.
3. Apply to Desired Chart:
- Add the strategy to the chart of the asset you wish to trade.
- Observe the plotted Fibonacci ATR and SMA Fibonacci ATR indicators for visual confirmation.
4. Monitor and Adjust:
- Regularly review the strategy’s performance through backtesting.
- Adjust the input parameters based on historical performance and changing market dynamics.
5. Risk Management:
- Ensure that the sum of take profit percentages does not exceed 100% to avoid over-closing positions.
- Utilize the ATR-based TP levels to adapt to varying market volatilities, maintaining a balanced risk-reward ratio.
█ Default Settings
Understanding the default settings is crucial for optimizing the Fibonacci ATR Fusion Strategy's performance. Here's a precise and simple overview of the key parameters and their effects:
🔶 Key Parameters and Their Effects
1. Trading Direction (`tradingDirection`)
- Default: Both
- Effect: Determines whether the strategy takes both long and short positions or restricts to one direction. Selecting Both allows maximum flexibility, while Long or Short can be used for directional bias.
2. Trading Condition Thresholds
Long Entry (long_entry_threshold = 58.0): Higher values reduce false positives but may miss trades.
Short Entry (short_entry_threshold = 42.0): Lower values capture early short trends but may increase false signals.
Long Exit (long_exit_threshold = 42.0): Exits long positions early, securing profits but potentially cutting trends short.
Short Exit (short_exit_threshold = 58.0): Delays short exits to capture favorable movements, avoiding premature exits.
3. Take Profit Configuration (`useTakeProfit` = false)
- Effect: When enabled, the strategy employs a 4-step TP mechanism to secure profits at multiple levels. By default, it is disabled to allow users to opt-in based on their trading style.
4. ATR-Based Take Profit Multipliers
TP1 (tp1ATR = 3.0): Sets the first TP at 3 ATRs for initial profit capture.
TP2 (tp2ATR = 8.0): Targets larger trends, though less likely to be reached.
TP3 (tp3ATR = 14.0): Optimizes for extreme price moves, seldom triggered.
5. Take Profit Percentages
TP Level 1 (tp1_percent = 12%): Secures 12% at the first TP.
TP Level 2 (tp2_percent = 12%): Exits another 12% at the second TP.
TP Level 3 (tp3_percent = 12%): Closes an additional 12% at the third TP.
6. Weighted Average Parameters
Ratio Periods: Fibonacci-based intervals (8, 13, 21, 34, 55) balance responsiveness.
Weights: Emphasizes recent data for timely responses to market trends.
SMA Period (weighted_avg_sma_period = 3): Smoothens data with minimal lag, balancing noise reduction and responsiveness.
7. ATR Period (`atrPeriod` = 14)
Effect: Sets the ATR calculation length, impacting TP sensitivity to volatility.
🔶 Impact on Performance
- Sensitivity and Responsiveness:
- Shorter Ratio Periods and Higher Weights: Make the weighted average more responsive to recent price changes, allowing quicker trade entries and exits but increasing the likelihood of false signals.
- Longer Ratio Periods and Lower Weights: Provide smoother signals with fewer false positives but may delay trade entries, potentially missing out on significant price moves.
- Profit Taking:
- ATR Multipliers: Higher multipliers set take profit levels further away, targeting larger price movements but reducing the probability of reaching these levels.
- Fixed Percentages: Allocating equal percentages at each TP level ensures consistent profit realization and risk management, preventing overexposure.
- Trade Direction Control:
- Selecting Specific Directions: Restricting trades to Long or Short can align the strategy with market trends or personal biases, potentially enhancing performance in trending markets.
- Risk Management:
- Take Profit Percentages: Dividing the position into smaller percentages at multiple TP levels helps lock in profits progressively, reducing risk and allowing the remaining position to ride further trends.
- Market Adaptability:
- Weighted Averages and ATR: By combining multiple timeframes and adjusting to volatility, the strategy adapts to different market conditions, maintaining effectiveness across various asset classes and timeframes.
---
If you want to know more about ATR, can also check "SuperATR 7-Step Profit".
Enjoy trading.

SuperATR 7-Step Profit - Strategy [presentTrading] Long time no see!
█ Introduction and How It Is Different
The SuperATR 7-Step Profit Strategy is a multi-layered trading approach that integrates adaptive Average True Range (ATR) calculations with momentum-based trend detection. What sets this strategy apart is its sophisticated 7-step take-profit mechanism, which combines four ATR-based exit levels and three fixed percentage levels. This hybrid approach allows traders to dynamically adjust to market volatility while systematically capturing profits in both long and short market positions.
Traditional trading strategies often rely on static indicators or single-layered exit strategies, which may not adapt well to changing market conditions. The SuperATR 7-Step Profit Strategy addresses this limitation by:
- Using Adaptive ATR: Enhances the standard ATR by making it responsive to current market momentum.
- Incorporating Momentum-Based Trend Detection: Identifies stronger trends with higher probability of continuation.
- Employing a Multi-Step Take-Profit System: Allows for gradual profit-taking at predetermined levels, optimizing returns while minimizing risk.
BTCUSD 6hr Performance
█ Strategy, How It Works: Detailed Explanation
The strategy revolves around detecting strong market trends and capitalizing on them using an adaptive ATR and momentum indicators. Below is a detailed breakdown of each component of the strategy.
🔶 1. True Range Calculation with Enhanced Volatility Detection
The True Range (TR) measures market volatility by considering the most significant price movements. The enhanced TR is calculated as:
TR = Max
Where:
High and Low are the current bar's high and low prices.
Previous Close is the closing price of the previous bar.
Abs denotes the absolute value.
Max selects the maximum value among the three calculations.
🔶 2. Momentum Factor Calculation
To make the ATR adaptive, the strategy incorporates a Momentum Factor (MF), which adjusts the ATR based on recent price movements.
Momentum = Close - Close
Stdev_Close = Standard Deviation of Close over n periods
Normalized_Momentum = Momentum / Stdev_Close (if Stdev_Close ≠ 0)
Momentum_Factor = Abs(Normalized_Momentum)
Where:
Close is the current closing price.
n is the momentum_period, a user-defined input (default is 7).
Standard Deviation measures the dispersion of closing prices over n periods.
Abs ensures the momentum factor is always positive.
🔶 3. Adaptive ATR Calculation
The Adaptive ATR (AATR) adjusts the traditional ATR based on the Momentum Factor, making it more responsive during volatile periods and smoother during consolidation.
Short_ATR = SMA(True Range, short_period)
Long_ATR = SMA(True Range, long_period)
Adaptive_ATR = /
Where:
SMA is the Simple Moving Average.
short_period and long_period are user-defined inputs (defaults are 3 and 7, respectively).
🔶 4. Trend Strength Calculation
The strategy quantifies the strength of the trend to filter out weak signals.
Price_Change = Close - Close
ATR_Multiple = Price_Change / Adaptive_ATR (if Adaptive_ATR ≠ 0)
Trend_Strength = SMA(ATR_Multiple, n)
🔶 5. Trend Signal Determination
If (Short_MA > Long_MA) AND (Trend_Strength > Trend_Strength_Threshold):
Trend_Signal = 1 (Strong Uptrend)
Elif (Short_MA < Long_MA) AND (Trend_Strength < -Trend_Strength_Threshold):
Trend_Signal = -1 (Strong Downtrend)
Else:
Trend_Signal = 0 (No Clear Trend)
🔶 6. Trend Confirmation with Price Action
Adaptive_ATR_SMA = SMA(Adaptive_ATR, atr_sma_period)
If (Trend_Signal == 1) AND (Close > Short_MA) AND (Adaptive_ATR > Adaptive_ATR_SMA):
Trend_Confirmed = True
Elif (Trend_Signal == -1) AND (Close < Short_MA) AND (Adaptive_ATR > Adaptive_ATR_SMA):
Trend_Confirmed = True
Else:
Trend_Confirmed = False
Local Performance
🔶 7. Multi-Step Take-Profit Mechanism
The strategy employs a 7-step take-profit system
█ Trade Direction
The SuperATR 7-Step Profit Strategy is designed to work in both long and short market conditions. By identifying strong uptrends and downtrends, it allows traders to capitalize on price movements in either direction.
Long Trades: Initiated when the market shows strong upward momentum and the trend is confirmed.
Short Trades: Initiated when the market exhibits strong downward momentum and the trend is confirmed.
█ Usage
To implement the SuperATR 7-Step Profit Strategy:
1. Configure the Strategy Parameters:
- Adjust the short_period, long_period, and momentum_period to match the desired sensitivity.
- Set the trend_strength_threshold to control how strong a trend must be before acting.
2. Set Up the Multi-Step Take-Profit Levels:
- Define ATR multipliers and fixed percentage levels according to risk tolerance and profit goals.
- Specify the percentage of the position to close at each level.
3. Apply the Strategy to a Chart:
- Use the strategy on instruments and timeframes where it has been tested and optimized.
- Monitor the positions and adjust parameters as needed based on performance.
4. Backtest and Optimize:
- Utilize TradingView's backtesting features to evaluate historical performance.
- Adjust the default settings to optimize for different market conditions.
█ Default Settings
Understanding default settings is crucial for optimal performance.
Short Period (3): Affects the responsiveness of the short-term MA.
Effect: Lower values increase sensitivity but may produce more false signals.
Long Period (7): Determines the trend baseline.
Effect: Higher values reduce noise but may delay signals.
Momentum Period (7): Influences adaptive ATR and trend strength.
Effect: Shorter periods react quicker to price changes.
Trend Strength Threshold (0.5): Filters out weaker trends.
Effect: Higher thresholds yield fewer but stronger signals.
ATR Multipliers: Set distances for ATR-based exits.
Effect: Larger multipliers aim for bigger moves but may reduce hit rate.
Fixed TP Levels (%): Control profit-taking on smaller moves.
Effect: Adjusting these levels affects how quickly profits are realized.
Exit Percentages: Determine how much of the position is closed at each TP level.
Effect: Higher percentages reduce exposure faster, affecting risk and reward.
Adjusting these variables allows you to tailor the strategy to different market conditions and personal risk preferences.
By integrating adaptive indicators and a multi-tiered exit strategy, the SuperATR 7-Step Profit Strategy offers a versatile tool for traders seeking to navigate varying market conditions effectively. Understanding and adjusting the key parameters enables traders to harness the full potential of this strategy.

Advanced Gold Scalping Strategy with RSI Divergence# Advanced Gold Scalping Strategy with RSI Divergence
## Overview
This Pine Script implements an advanced scalping strategy for gold (XAUUSD) trading, primarily designed for the 1-minute timeframe. The strategy utilizes the Relative Strength Index (RSI) indicator along with its moving average to identify potential trade setups based on divergences between price action and RSI movements.
## Key Components
### 1. RSI Calculation
- Uses a customizable RSI length (default: 60)
- Allows selection of the source for RSI calculation (default: close price)
### 2. Moving Average of RSI
- Supports multiple MA types: SMA, EMA, SMMA (RMA), WMA, VWMA, and Bollinger Bands
- Customizable MA length (default: 3)
- Option to display Bollinger Bands with adjustable standard deviation multiplier
### 3. Divergence Detection
- Implements both bullish and bearish divergence identification
- Uses pivot high and pivot low points to detect divergences
- Allows for customization of lookback periods and range for divergence detection
### 4. Entry Conditions
- Long Entry: Bullish divergence when RSI is below 40
- Short Entry: Bearish divergence when RSI is above 60
### 5. Trade Management
- Stop Loss: Customizable, default set to 11 pips
- Take Profit: Customizable, default set to 33 pips
### 6. Visualization
- Plots RSI line and its moving average
- Displays horizontal lines at 30, 50, and 70 RSI levels
- Shows Bollinger Bands when selected
- Highlights divergences with "Bull" and "Bear" labels on the chart
## Input Parameters
- RSI Length: Adjusts the period for RSI calculation
- RSI Source: Selects the price source for RSI (close, open, high, low, hl2, hlc3, ohlc4)
- MA Type: Chooses the type of moving average applied to RSI
- MA Length: Sets the period for the moving average
- BB StdDev: Adjusts the standard deviation multiplier for Bollinger Bands
- Show Divergence: Toggles the display of divergence labels
- Stop Loss: Sets the stop loss distance in pips
- Take Profit: Sets the take profit distance in pips
## Strategy Logic
1. **RSI Calculation**:
- Computes RSI using the specified length and source
- Calculates the chosen type of moving average on the RSI
2. **Divergence Detection**:
- Identifies pivot points in both price and RSI
- Checks for higher lows in RSI with lower lows in price (bullish divergence)
- Checks for lower highs in RSI with higher highs in price (bearish divergence)
3. **Trade Entry**:
- Enters a long position when a bullish divergence is detected and RSI is below 40
- Enters a short position when a bearish divergence is detected and RSI is above 60
4. **Position Management**:
- Places a stop loss order at the entry price ± stop loss pips (depending on the direction)
- Sets a take profit order at the entry price ± take profit pips (depending on the direction)
5. **Visualization**:
- Plots the RSI and its moving average
- Draws horizontal lines for overbought/oversold levels
- Displays Bollinger Bands if selected
- Shows divergence labels on the chart for identified setups
## Usage Instructions
1. Apply the script to a 1-minute XAUUSD (Gold) chart in TradingView
2. Adjust the input parameters as needed:
- Increase RSI Length for less frequent but potentially more reliable signals
- Modify MA Type and Length to change the sensitivity of the RSI moving average
- Adjust Stop Loss and Take Profit levels based on current market volatility
3. Monitor the chart for Bull (long) and Bear (short) labels indicating potential trade setups
4. Use in conjunction with other analysis and risk management techniques
## Considerations
- This strategy is designed for short-term scalping and may not be suitable for all market conditions
- Always backtest and forward test the strategy before using it with real capital
- The effectiveness of divergence-based strategies can vary depending on market trends and volatility
- Consider using additional confirmation signals or filters to improve the strategy's performance
Remember to adapt the strategy parameters to your risk tolerance and trading style, and always practice proper risk management.

HilalimSB Strategy HilalimSB A Wedding Gift 🌙
What is HilalimSB🌙?
First of all, as mentioned in the title, HilalimSB is a wedding gift.
HilalimSB - Revealing the Secrets of the Trend
HilalimSB is a powerful indicator designed to help investors analyze market trends and optimize trading strategies. Designed to uncover the secrets at the heart of the trend, HilalimSB stands out with its unique features and impressive algorithm.
Hilalim Algorithm and Fixed ATR Value:
HilalimSB is equipped with a special algorithm called "Hilalim" to detect market trends. This algorithm can delve into the depths of price movements to determine the direction of the trend and provide users with the ability to predict future price movements. Additionally, HilalimSB uses its own fixed Average True Range (ATR) value. ATR is an indicator that measures price movement volatility and is often used to determine the strength of a trend. The fixed ATR value of HilalimSB has been tested over long periods and its reliability has been proven. This allows users to interpret the signals provided by the indicator more reliably.
ATR Calculation Steps
1.True Range Calculation:
+ The True Range (TR) is the greatest of the following three values:
1. Current high minus current low
2. Current high minus previous close (absolute value)
3. Current low minus previous close (absolute value)
2.Average True Range (ATR) Calculation:
-The initial ATR value is calculated as the average of the TR values over a specified period
(typically 14 periods).
-For subsequent periods, the ATR is calculated using the following formula:
ATRt=(ATRt−1×(n−1)+TRt)/n
Where:
+ ATRt is the ATR for the current period,
+ ATRt−1 is the ATR for the previous period,
+ TRt is the True Range for the current period,
+ n is the number of periods.
Pine Script to Calculate ATR with User-Defined Length and Multiplier
Here is the Pine Script code for calculating the ATR with user-defined X length and Y multiplier:
//@version=5
indicator("Custom ATR", overlay=false)
// User-defined inputs
X = input.int(14, minval=1, title="ATR Period (X)")
Y = input.float(1.0, title="ATR Multiplier (Y)")
// True Range calculation
TR1 = high - low
TR2 = math.abs(high - close )
TR3 = math.abs(low - close )
TR = math.max(TR1, math.max(TR2, TR3))
// ATR calculation
ATR = ta.rma(TR, X)
// Apply multiplier
customATR = ATR * Y
// Plot the ATR value
plot(customATR, title="Custom ATR", color=color.blue, linewidth=2)
This code can be added as a new Pine Script indicator in TradingView, allowing users to calculate and display the ATR on the chart according to their specified parameters.
HilalimSB's Distinction from Other ATR Indicators
HilalimSB emerges with its unique Average True Range (ATR) value, presenting itself to users. Equipped with a proprietary ATR algorithm, this indicator is released in a non-editable form for users. After meticulous testing across various instruments with predetermined period and multiplier values, it is made available for use.
ATR is acknowledged as a critical calculation tool in the financial sector. The ATR calculation process of HilalimSB is conducted as a result of various research efforts and concrete data-based computations. Therefore, the HilalimSB indicator is published with its proprietary ATR values, unavailable for modification.
The ATR period and multiplier values provided by HilalimSB constitute the fundamental logic of a trading strategy. This unique feature aids investors in making informed decisions.
Visual Aesthetics and Clear Charts:
HilalimSB provides a user-friendly interface with clear and impressive graphics. Trend changes are highlighted with vibrant colors and are visually easy to understand. You can choose colors based on eye comfort, allowing you to personalize your trading screen for a more enjoyable experience. While offering a flexible approach tailored to users' needs, HilalimSB also promises an aesthetic and professional experience.
Strong Signals and Buy/Sell Indicators:
After completing test operations, HilalimSB produces data at various time intervals. However, we would like to emphasize to users that based on our studies, it provides the best signals in 1-hour chart data. HilalimSB produces strong signals to identify trend reversals. Buy or sell points are clearly indicated, allowing users to develop and implement trading strategies based on these signals.
For example, let's imagine you wanted to open a position on BTC on 2023.11.02. You are aware that you need to calculate which of the buying or selling transactions would be more profitable. You need support from various indicators to open a position. Based on the analysis and calculations it has made from the data it contains, HilalimSB would have detected that the graph is more suitable for a selling position, and by producing a sell signal at the most ideal selling point at 08:00 on 2023.11.02 (UTC+3 Istanbul), it would have informed you of the direction the graph would follow, allowing you to benefit positively from a 2.56% decline.
Technology and Innovation:
HilalimSB aims to enhance the trading experience using the latest technology. With its innovative approach, it enables users to discover market opportunities and support their decisions. Thus, investors can make more informed and successful trades. Real-Time Data Analysis: HilalimSB analyzes market data in real-time and identifies updated trends instantly. This allows users to make more informed trading decisions by staying informed of the latest market developments. Continuous Update and Improvement: HilalimSB is constantly updated and improved. New features are added and existing ones are enhanced based on user feedback and market changes. Thus, HilalimSB always aims to provide the latest technology and the best user experience.
Social Order and Intrinsic Motivation:
Negative trends such as widespread illegal gambling and uncontrolled risk-taking can have adverse financial effects on society. The primary goal of HilalimSB is to counteract these negative trends by guiding and encouraging users with data-driven analysis and calculable investment systems. This allows investors to trade more consciously and safely.
What is HilalimSB Strategy🌙?
HilalimSB Strategy is a strategy that is supported by the HilalimSB algorithm created by the creator of HilalimSB and continues transactions with take profit and stop loss levels determined by users who strategically and automatically open transactions as a result of the data it receives and automatically closes transactions under necessary conditions. It is a first in the tradingview world with its unique take profit and stop loss markings. HilalimSB Strategy is open to users' initiatives and is a trading strategy developed on BTC.
What does the HilalimSB Strategy target?
The main purpose of HilalimSB Strategy is to reduce the transaction load of traders and to be integrated into various brokerage firms and operated by automatic trading bots, and it is aimed to serve this purpose. In addition to the strategies currently available in the markets, HilalimSB Strategy offers a useful infrastructure to traders with its useful interface. HilalimSB Strategy, which was decided to be published as a result of various calculations, was offered to the users with its unique visual effects after the completion of the testing procedures under market conditions.
HilalimSB Strategy and Heikin Ashi
HilalimSB Strategy produces data in Heikin Ashi chart types, but since Heikin Ashi chart types have their own calculation method, HilalimSB Strategy has been published in a way that cannot produce data in this chart type due to HilalimSB Strategy's ideology of appealing to all types of users, and any confusion that may arise is prevented in this way.
After the necessary conditions determined by the creator of HilalimSB are met, HilalimSB Heikin Ashi will be shared exclusively with invited users only, upon request, to users who request an invitation.
Differences between HilalimSB Strategy and HilalimSB
HilalimSB Strategy has been shared as a strategy and its features have been explained above. HilalimSB is a trading indicator and this is the main difference between them.We can explain it briefly this way.
Here are the differences between indicators and strategies:
1.Purpose and Use:
Indicators: Analyze market data to provide information about price movements and trends. They typically generate buy and sell signals and give traders clues about when to make trades in the market.
Strategies: These are plans for trading based on specific rules. They use signals from indicators and other market data to execute buy and sell transactions.
2.Features:
Indicators: Operate independently and are based on specific mathematical formulas. Examples include moving averages, RSI, and MACD.
Strategies: Combine one or more indicators and other market analysis tools to create a comprehensive trading plan. This plan determines entry and exit points, risk management, and trade size.
3.Scope:
Indicators: Are single analysis tools focusing on specific time frames or price movements.
Strategies: Are comprehensive trading plans that typically involve multiple trades over a certain period.
4.Decision Making:
Indicators: Provide information to traders and help in the decision-making process.
Strategies: Are direct decision-making mechanisms that execute trades automatically according to predetermined rules.
5.Automation:
Indicators: Are mostly interpreted manually and used based on the trader’s discretion.
Strategies: Can be used in automated trading systems and execute trades automatically according to the set rules.
The shared image is a 1-hour chart of BTCUSDC.P determined by the user as 1 percent take profit and 1 percent stop loss. And transactions were opened on Binance with the commission rate determined as 0.017 for the USDC trading pair.
HilalimSB Strategy, which presents users with completely concrete data, has proven itself in testing processes and is a project of SB that aims to reach all user profiles.🌙
